Fig. 13
Download original image
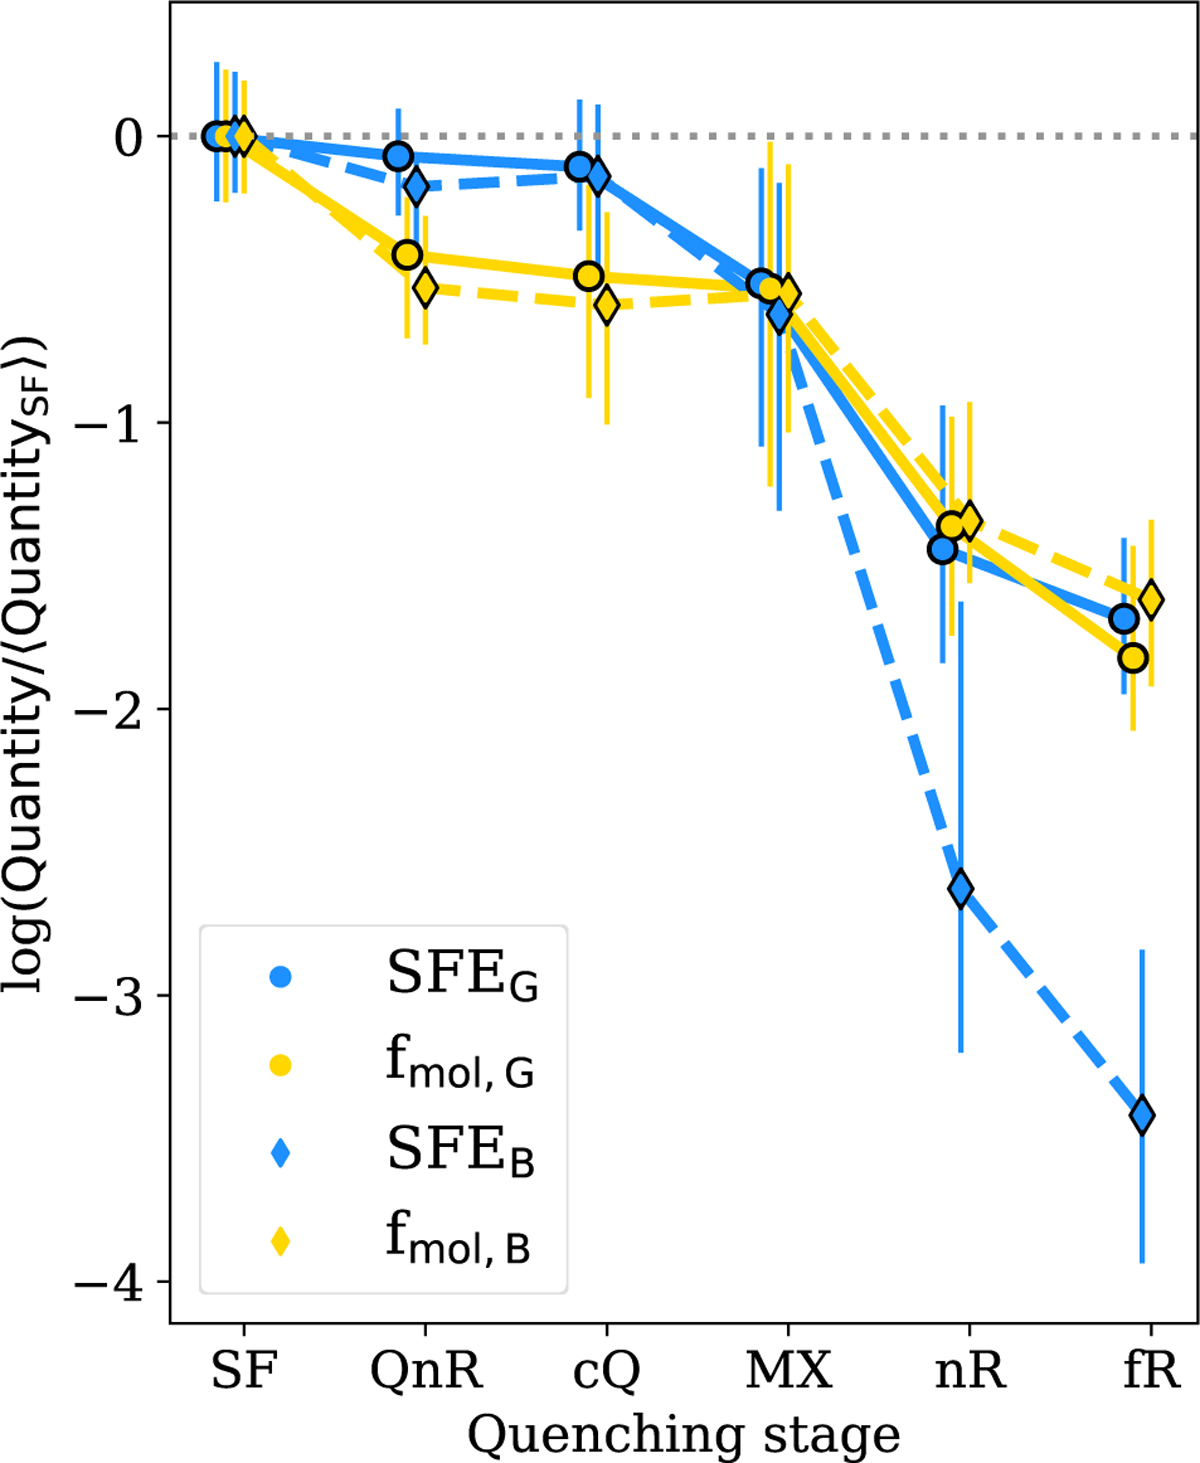
Flaring plots highlighting the behaviour of global and beam SFE (blue) and fmol (yellow). The symbols and conventions follow Fig. 7. While the evolution of the galaxies from the SF to the MX group is mostly driven by decrements of fmol, the significant drop (from MX to the nR/fR groups) in SFR in the centre of the galaxies is dominated by decrements of SFE.
Current usage metrics show cumulative count of Article Views (full-text article views including HTML views, PDF and ePub downloads, according to the available data) and Abstracts Views on Vision4Press platform.
Data correspond to usage on the plateform after 2015. The current usage metrics is available 48-96 hours after online publication and is updated daily on week days.
Initial download of the metrics may take a while.