Fig. 12
Download original image
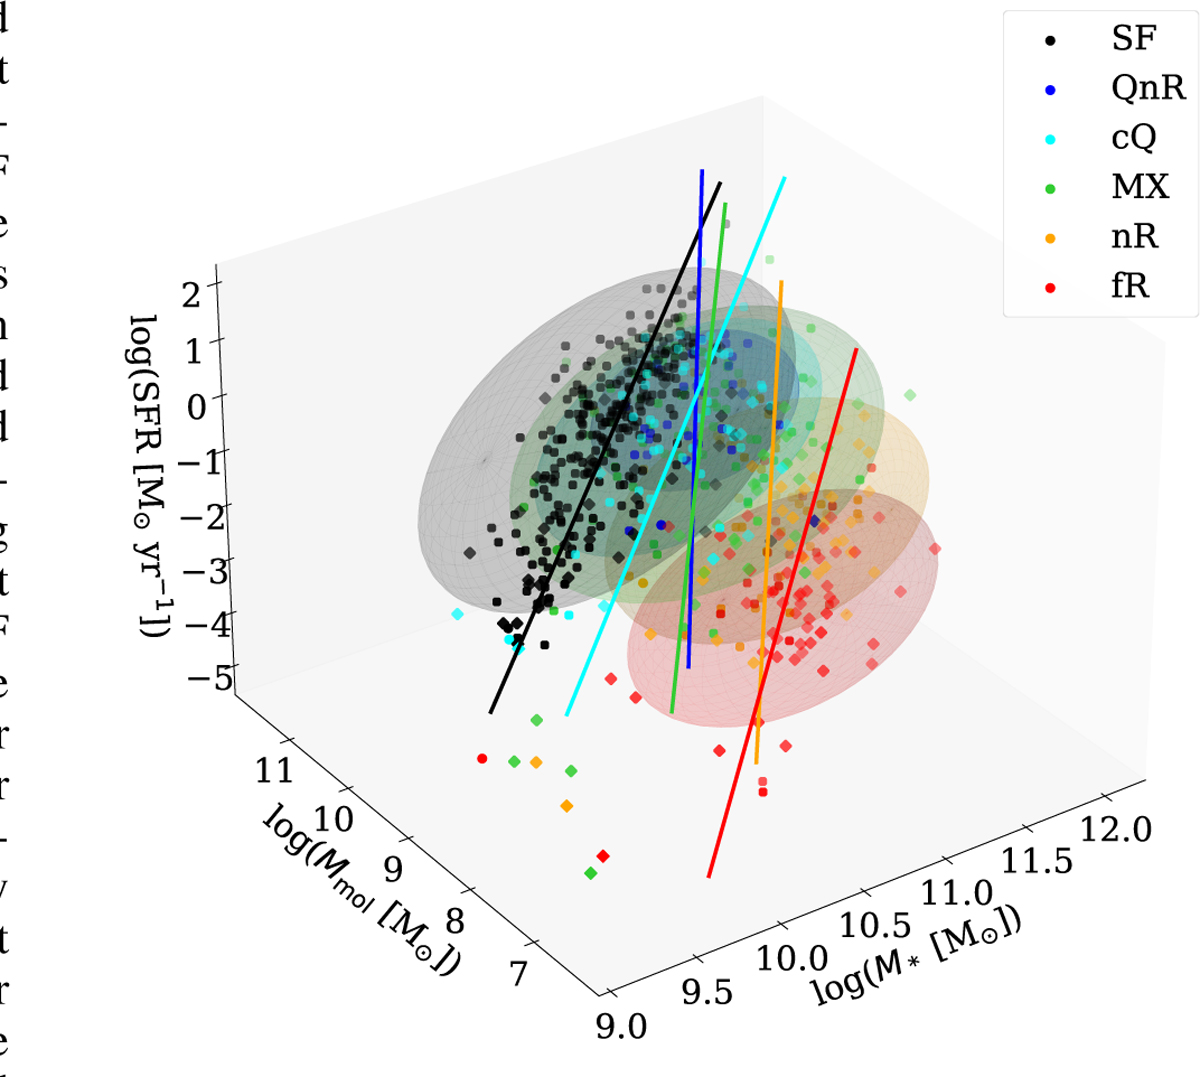
Three-dimensional star formation scaling relations involving star formation rate (SFR), stellar mass (M*), and molecular gas mass (Mmol). Different colours indicate galaxies at given quenching stages. Additionally, for each group, the confidence ellipsoids and the direction of maximal variation in the space (full lines) are calculated with PCA. Circles show CO-detected galaxies, while diamonds indicate CO non-detected galaxies (with S/N<3). Only SF galaxies form a well-defined linear distribution in the three-dimensional space.
Current usage metrics show cumulative count of Article Views (full-text article views including HTML views, PDF and ePub downloads, according to the available data) and Abstracts Views on Vision4Press platform.
Data correspond to usage on the plateform after 2015. The current usage metrics is available 48-96 hours after online publication and is updated daily on week days.
Initial download of the metrics may take a while.