Fig. 10
Download original image
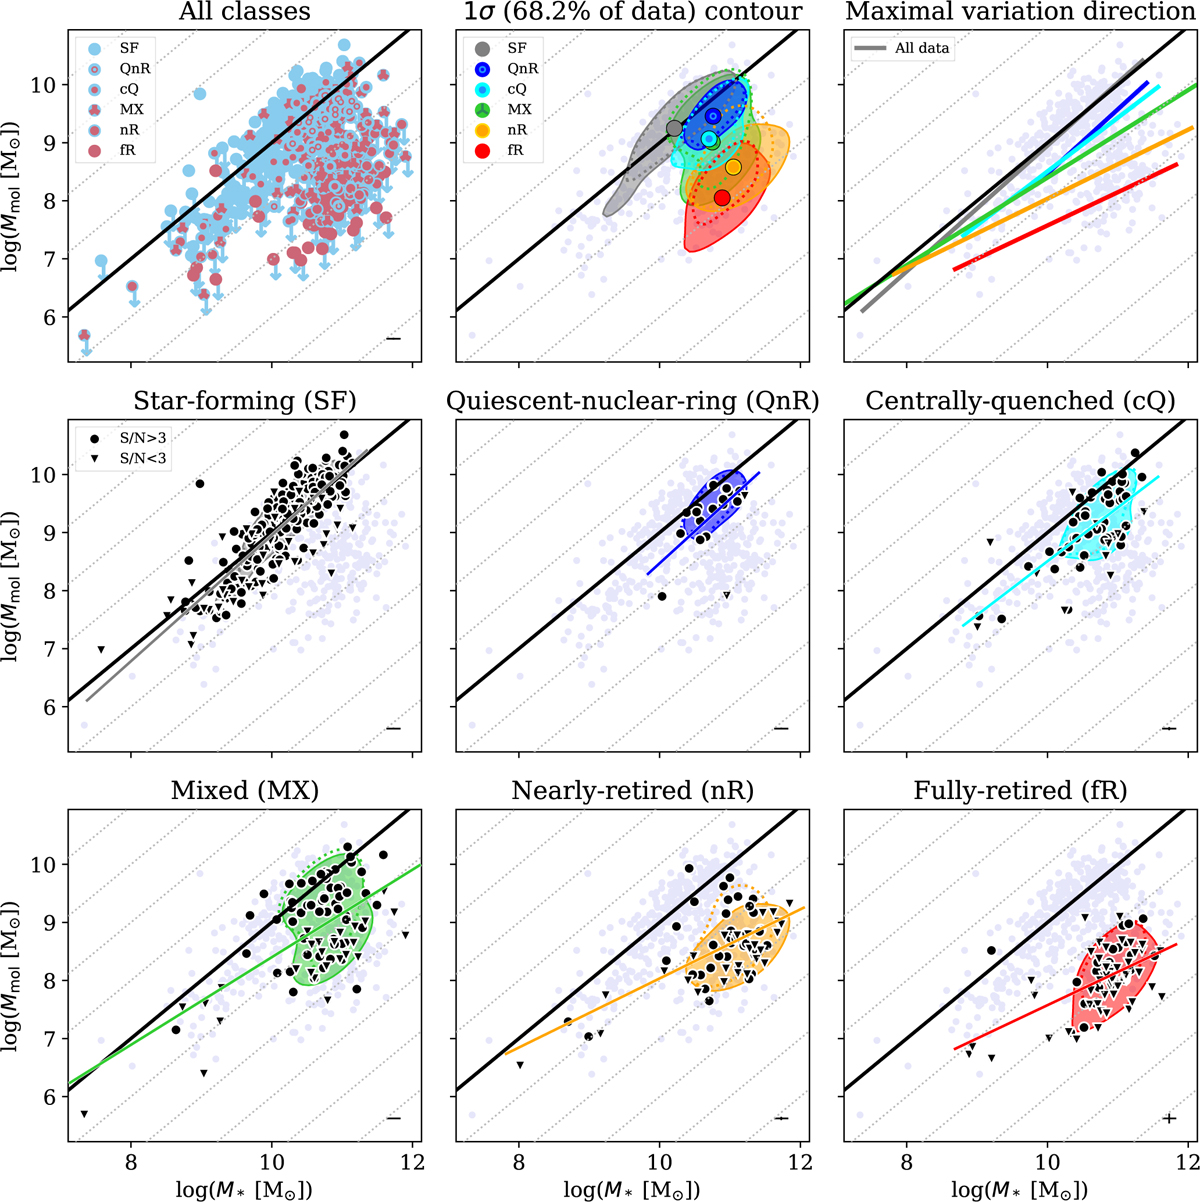
Diagram of Mmol − M* from the iEDGE in different representations. Symbols and conventions follow Fig. 8. Across the panels, the solid black line across the panel shows the locus where fmol = 0.1. Additionally, dotted lines show a constant fmol from (bottom to top) 10−5 to 104. Moving from quenching stages dominated by star formation to the ones dominated by retired regions, the relationships between Mmol − M* shift to lower molecular gas fractions and become shallower.
Current usage metrics show cumulative count of Article Views (full-text article views including HTML views, PDF and ePub downloads, according to the available data) and Abstracts Views on Vision4Press platform.
Data correspond to usage on the plateform after 2015. The current usage metrics is available 48-96 hours after online publication and is updated daily on week days.
Initial download of the metrics may take a while.