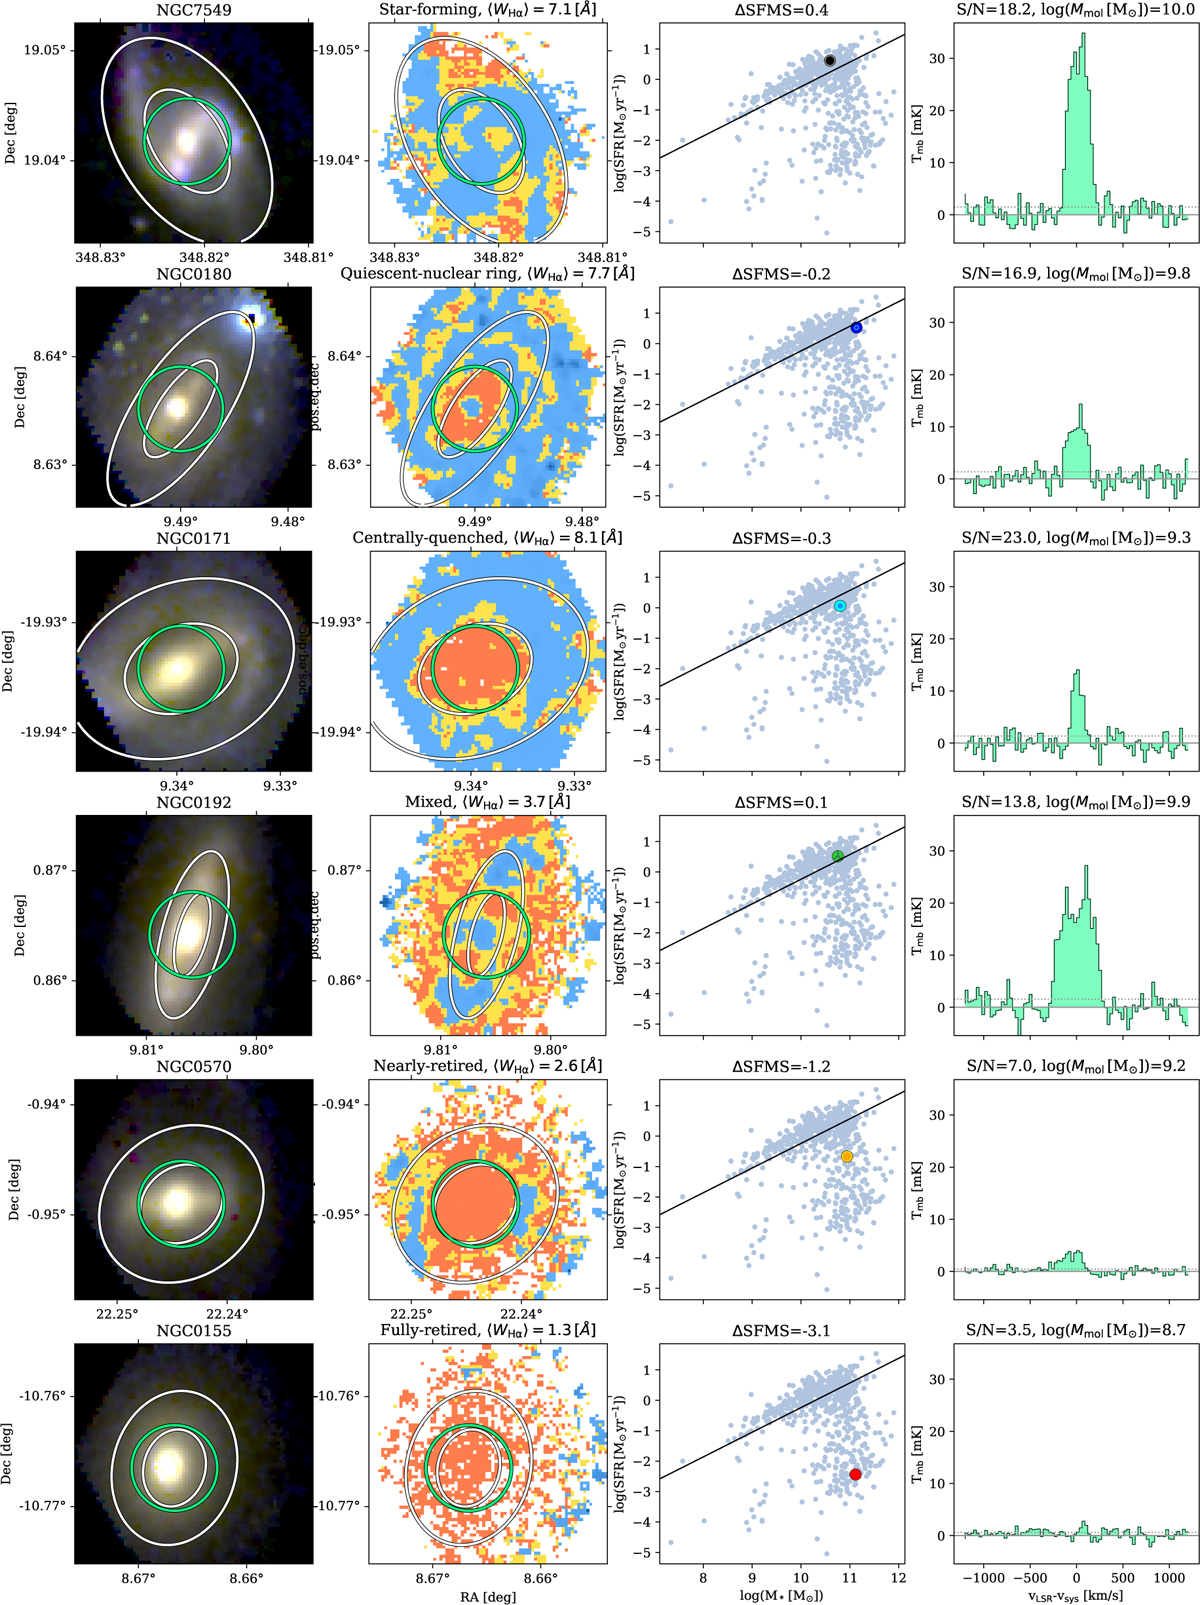
Fig. 1
Download original image
From top to bottom: examples of galaxies at different ‘quenching stages’. First column: continuum RGB images extracted from the CALIFA datacubes using u– (blue), g– (green), and r– (red) bands. In the title, the galaxy name is given. Second column: discrete WHα maps. Here, blue indicates the region dominated by star formation, yellow shows diffuse gas regions, and red displays quenched regions (see text for more details). The title shows the ‘quenching stage’ and the median WHα across the full map. In the first and second column images, white ellipses mark the locations of 1 and 2 Re, the green circle indicates the extend and position of the APEX beam at 230 GHz (26.2″), from which the spectra on the rightmost column are obtained. Third column: position of the galaxy on the SFR-M* diagram. The grey dots show the location of every galaxy in our sample. The SFMS fit (black line) is taken from Cano-Díaz et al. (2016). The title gives the global distance from the SFMS, ΔSFMS. Fourth column: APEX 12CO(2-1) spectra (green) in Tmb units. All spectra have been shifted to 0 km s−1 considering the systemic velocity of the galaxy (Vsys). The dotted line represents the observation σRMS. In the title, the S/N of the observation is given, together with the molecular gas mass. The assembled database contains CO information for several galaxies across each quenching stage and having different distances from the SFMS.
Current usage metrics show cumulative count of Article Views (full-text article views including HTML views, PDF and ePub downloads, according to the available data) and Abstracts Views on Vision4Press platform.
Data correspond to usage on the plateform after 2015. The current usage metrics is available 48-96 hours after online publication and is updated daily on week days.
Initial download of the metrics may take a while.