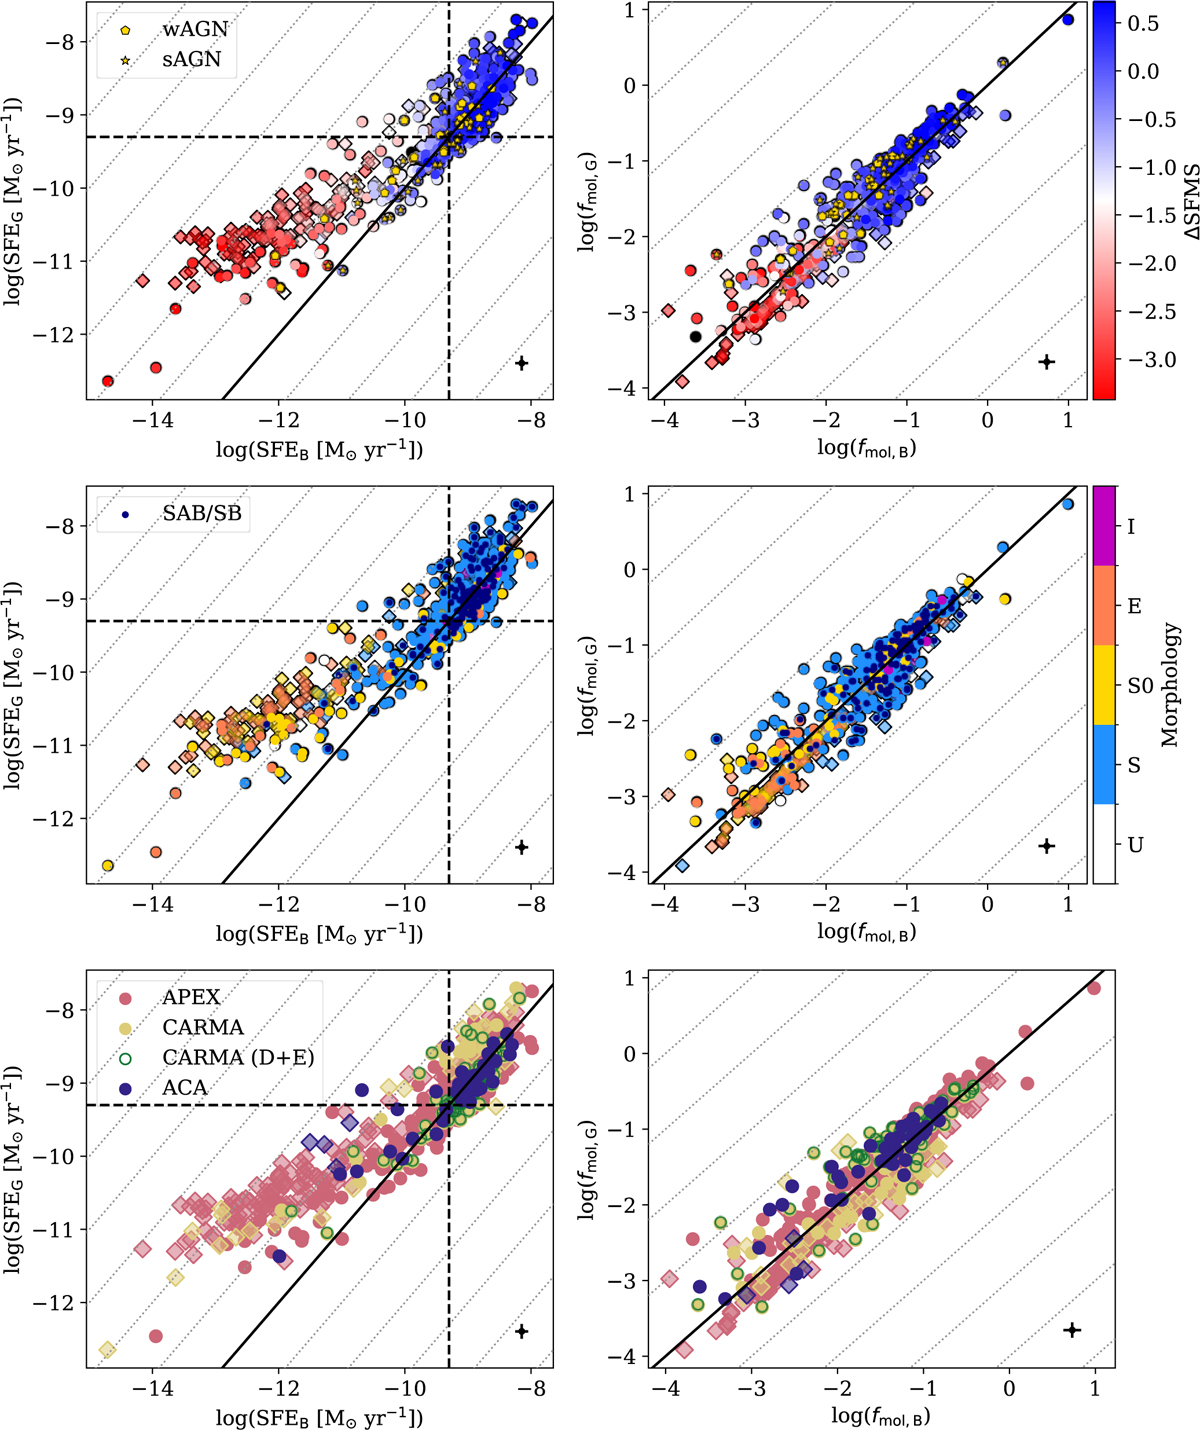
Fig. 9
Download original image
Relationships between global and beam quantities, namely star formation efficiency, SFE, left column, and molecular gas fraction fmol, right column, colour-coded by the distance from the SFMS (ΔSFMS, top row), morphology (middle row), and the different samples included in the database (bottom row). In the panels, the black full line shows the 1:1 locus, while grey dotted lines are separated by 1 dex. The black dashed lines in the left column indicate a τdep = 2 Gyr. In the top row, the yellow pentagons show the positions of the wAGN-hosts in the sample, while the yellow stars show the positions of sAGN-hosts. In the middle row, dark blue dots show the locations of the SAB/SB galaxies. In the panels, the transparent diamonds are used to indicate that a given measurement is obtained with a CO upper limit. While fmol does not appear to vary across the galaxy discs, the SFE in the centre of the retired early-type galaxies in particular is ~1 dex lower compared to the SFE across the entire galaxies.
Current usage metrics show cumulative count of Article Views (full-text article views including HTML views, PDF and ePub downloads, according to the available data) and Abstracts Views on Vision4Press platform.
Data correspond to usage on the plateform after 2015. The current usage metrics is available 48-96 hours after online publication and is updated daily on week days.
Initial download of the metrics may take a while.