Fig. 7
Download original image
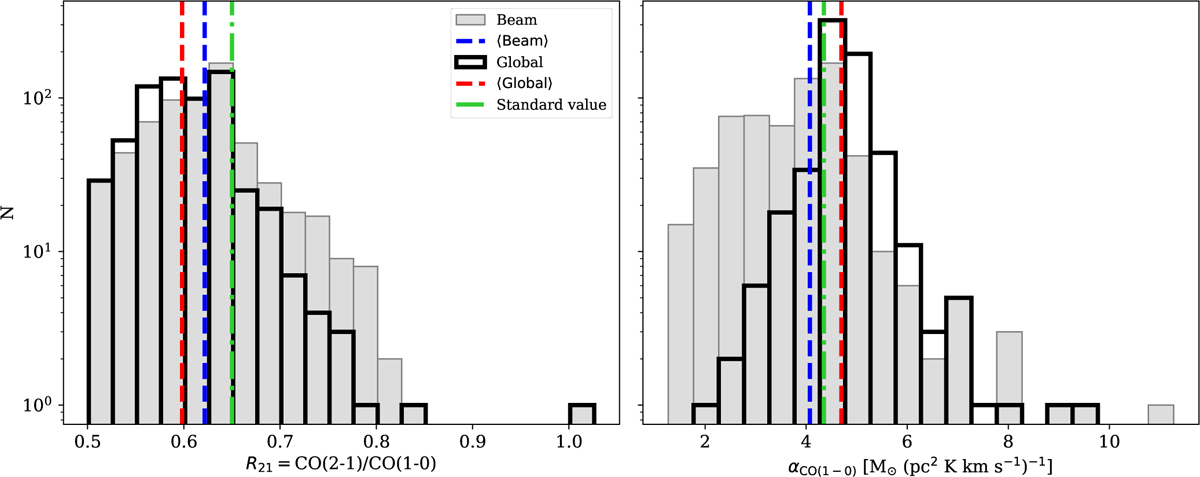
Distributions of the inferred CO(2-1)-to-CO(1-0) ratio (R21, left) and CO(1-0)-to-H2 conversion factors (αCO(1–0), right). These quantities are derived using IFU maps from models described in Equations (13) and (14) (for αCO(1–0) and R21, respectively). Histograms show median R21 and αCO(1–0) calculated across the full maps (global, empty black histograms) and tapered maps (beam, grey histograms). The red (blue) dashed lines indicate the median of the global (beam) quantities, while the green dash-dotted lines show the typical values adopted for star-forming galaxies in the local Universe (e.g. R21 = 0.65 and αCO(1–0) = 4.35 M⊙ (pc2 K km s−1)−1). Regarding R21, we measured medians (depending on the coverage) generally lower than the average values observed in nearby galaxies. The αCO(1–0) values span an order of magnitude, with lower conversion factors measured within the galaxy centres. This is consistent with the fact that galaxies exhibit a declining metallicity trend with respect to the galactocentric radius, hence showing lower αCO(1–0) in their centre (see also Appendix A).
Current usage metrics show cumulative count of Article Views (full-text article views including HTML views, PDF and ePub downloads, according to the available data) and Abstracts Views on Vision4Press platform.
Data correspond to usage on the plateform after 2015. The current usage metrics is available 48-96 hours after online publication and is updated daily on week days.
Initial download of the metrics may take a while.