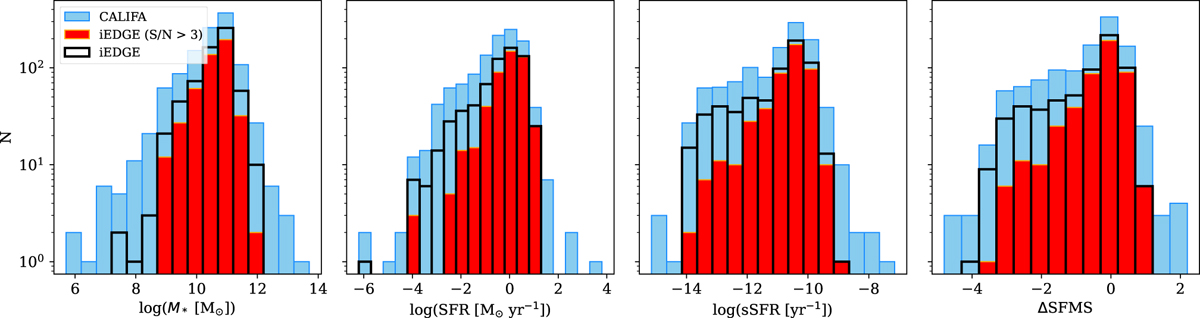
Fig. 6
Download original image
Histograms across samples (full CALIFA, cyan bars; galaxies in the full iEDGE sample, black empty bars; CO detected galaxies in the iEDGE, red bars) related (from left to right) to M*, SFR, specific SFR (sSFR=SFR/M*), and logarithmic distance from the SF main sequence (ΔSFMS). Similarly to CALIFA, iEDGE spans a representative range of SFR, M*, and related values. However, CO detections decrease at low sSFR and ΔSFMS values.
Current usage metrics show cumulative count of Article Views (full-text article views including HTML views, PDF and ePub downloads, according to the available data) and Abstracts Views on Vision4Press platform.
Data correspond to usage on the plateform after 2015. The current usage metrics is available 48-96 hours after online publication and is updated daily on week days.
Initial download of the metrics may take a while.