Fig. 5
Download original image
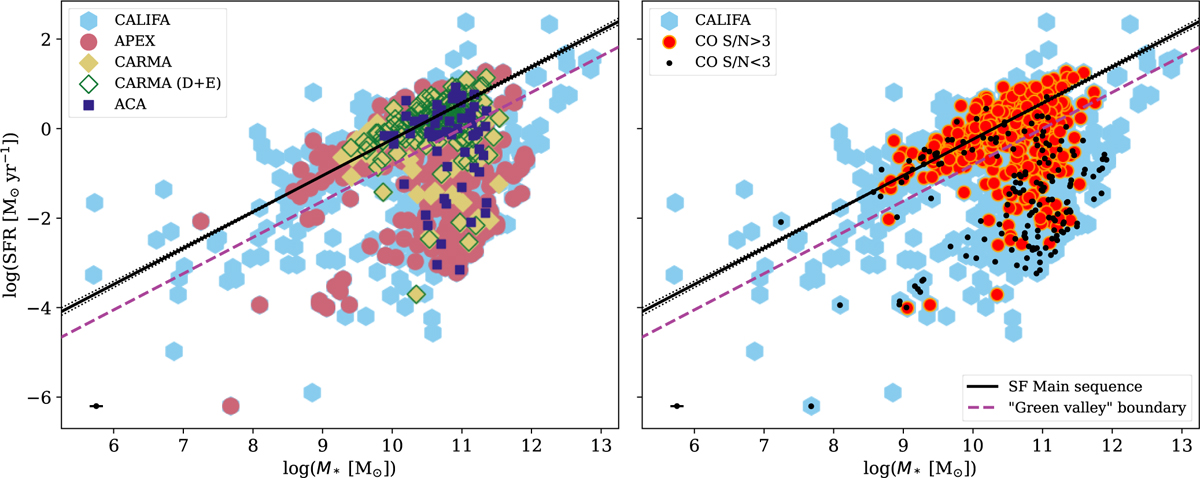
SFR-M* diagrams defined by the different samples considered in this paper (left panel): full CALIFA (cyan hexagons), and galaxies observed in CO lines by APEX (red circles), CARMA (yellow diamonds), CARMA (D+E galaxies only, empty green diamonds), ACA (blue squares). In the right panel, the red circles represent CO-detected galaxies (with S/N > 3), while the black dots show CO non-detections (with S/N < 3). In both panels, the black line shows Cano-Díaz et al. (2016) the SFMS model with the uncertainties (dotted lines). The dashed purple line indicates the green valley boundary position defined in C20, which is located 3σ (equal to 0.20 dex as in Cano-Díaz et al. 2016) from the SFMS. APEX targets extend from the SFMS to the retired regions, better representing the CALIFA galaxies in this diagram.
Current usage metrics show cumulative count of Article Views (full-text article views including HTML views, PDF and ePub downloads, according to the available data) and Abstracts Views on Vision4Press platform.
Data correspond to usage on the plateform after 2015. The current usage metrics is available 48-96 hours after online publication and is updated daily on week days.
Initial download of the metrics may take a while.