Fig. 3
Download original image
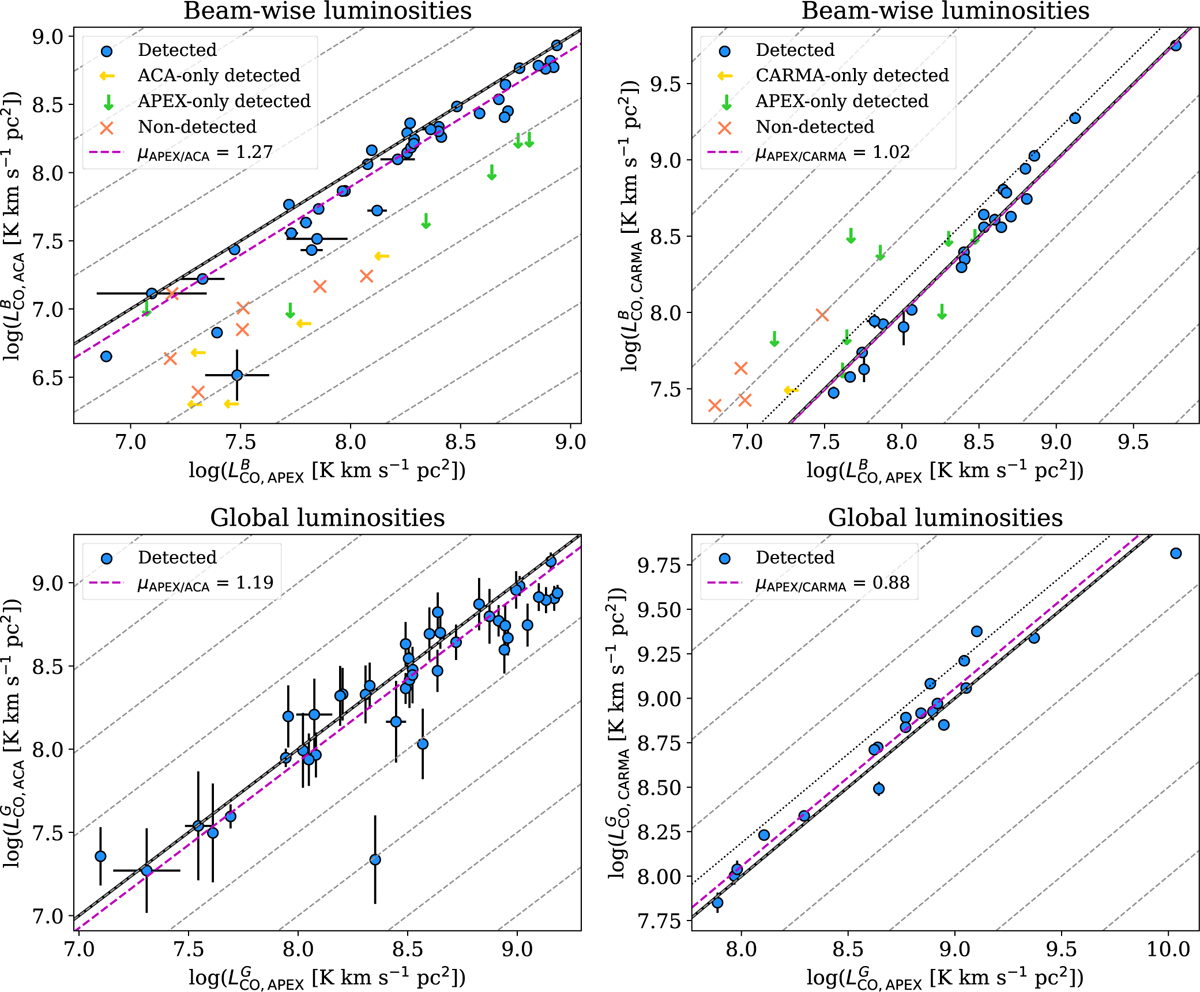
Comparison between beam-wise (top panels) and global luminosities (bottom panels) from ACA and APEX (left panels) and from CARMA and APEX (right panels). The blue circles indicate galaxies detected (with S/N > 3) from both telescopes, yellow arrows indicate galaxies detected only by ACA or CARMA, the green arrows indicate galaxies detected only by APEX, and the red crosses show galaxies not detected by both telescopes. For non-detections, luminosities are given as upper limits. For global luminosities, we show only the detections from both telescopes (see the text for further details). The black solid lines mark the 1:1 locus. The magenta dashed line has a unitary slope and an intercept equal to the median ratio between the x – and the y-quantities. In addition, in the left panels, the dotted black line marks the location where the CO(2-1)-to-CO(1-0) ratio, R21 = 0.65. The grey dashed lines have a unitary slope and are separated by 0.5 dex.
Current usage metrics show cumulative count of Article Views (full-text article views including HTML views, PDF and ePub downloads, according to the available data) and Abstracts Views on Vision4Press platform.
Data correspond to usage on the plateform after 2015. The current usage metrics is available 48-96 hours after online publication and is updated daily on week days.
Initial download of the metrics may take a while.