Open Access
Fig. 2
Download original image
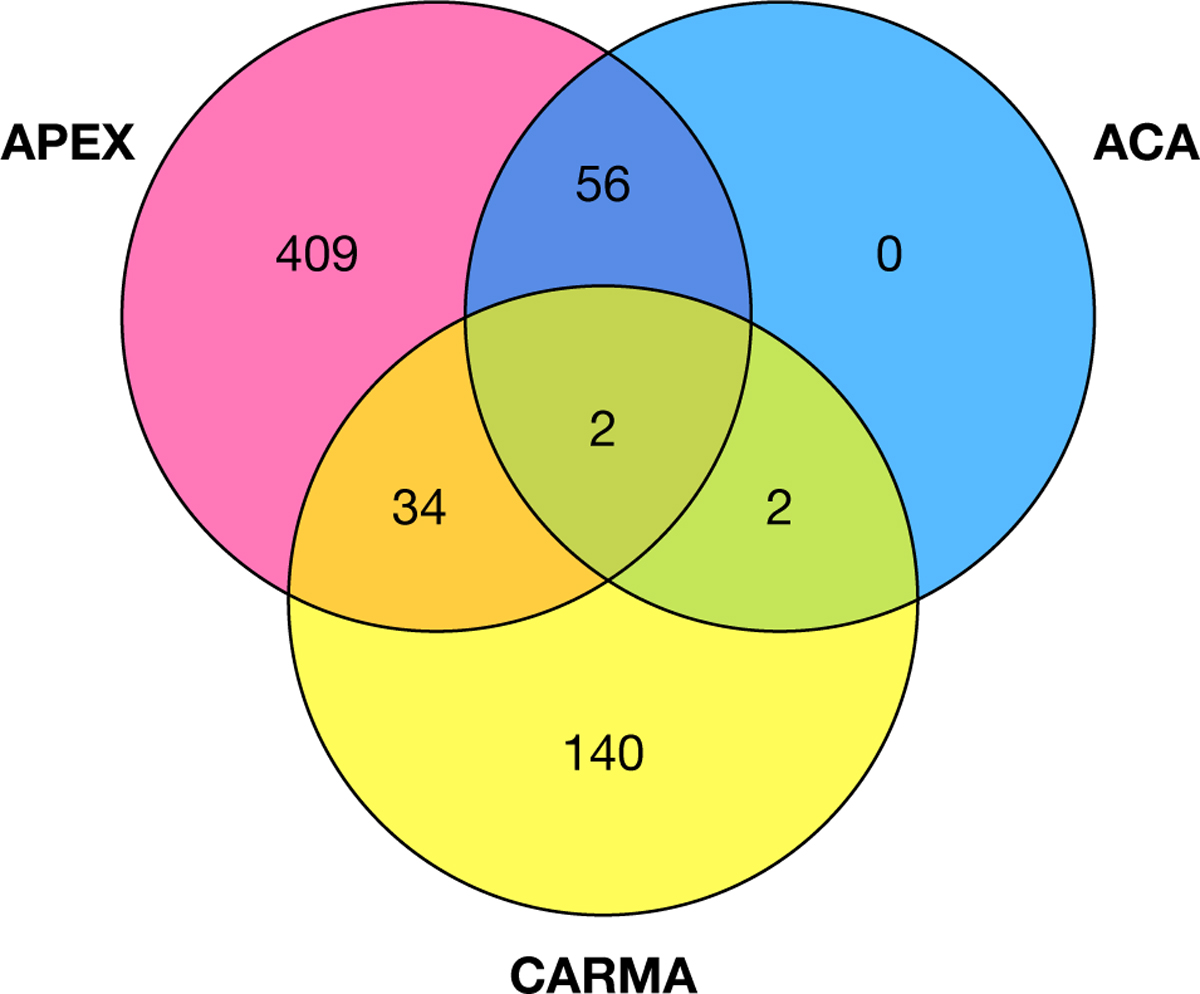
Number of galaxies within the iEDGE observed by the different telescopes represented as a Venn diagram. Objects solely observed by APEX eventually constitute 64% of the final database, and CARMA data add up to 22% of the database. The rest of the targets have been observed by multiple telescopes.
Current usage metrics show cumulative count of Article Views (full-text article views including HTML views, PDF and ePub downloads, according to the available data) and Abstracts Views on Vision4Press platform.
Data correspond to usage on the plateform after 2015. The current usage metrics is available 48-96 hours after online publication and is updated daily on week days.
Initial download of the metrics may take a while.