Fig. A.2
Download original image
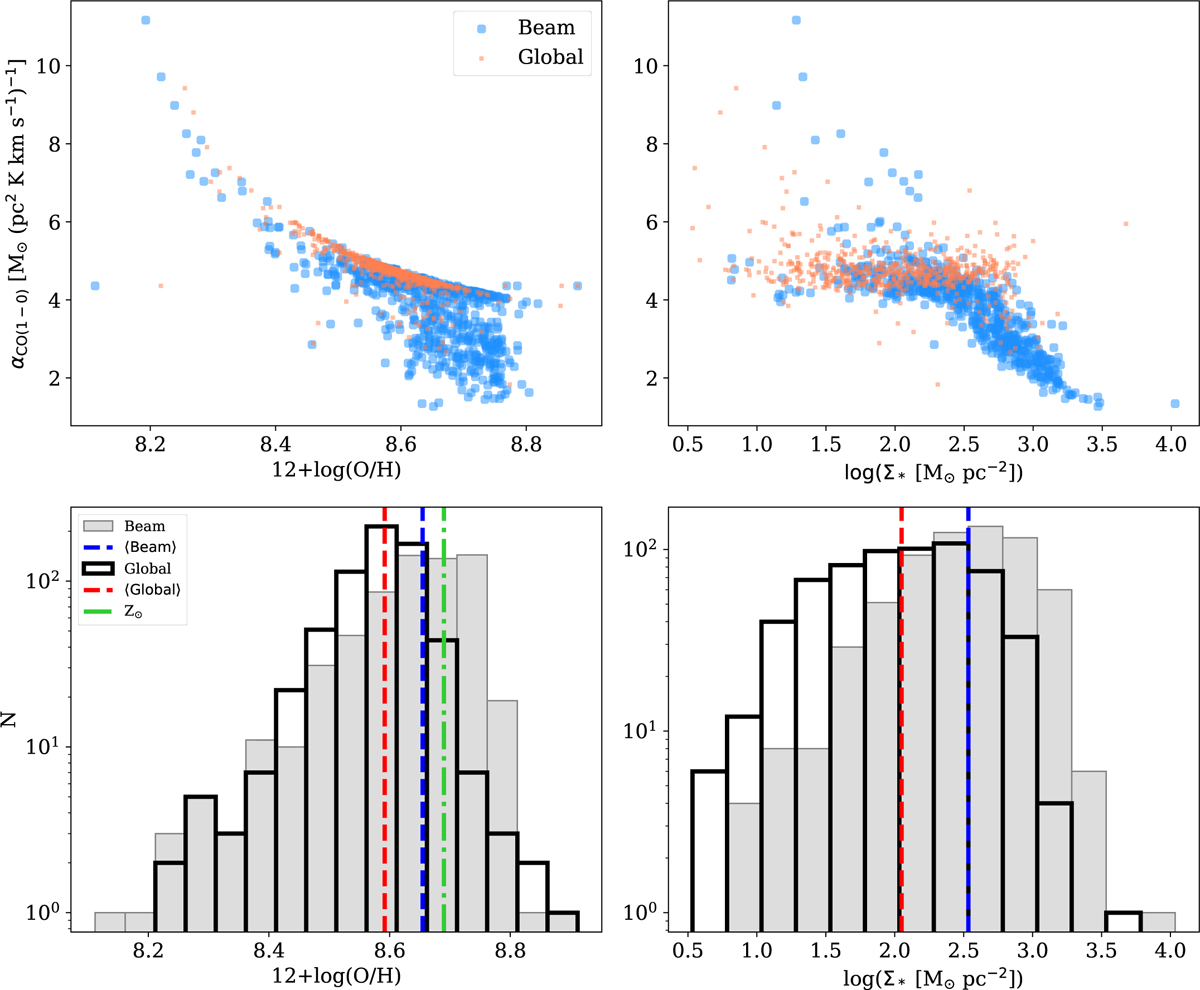
Upper row: Relation between beam (blue circles) and global (red dots) αCO(1–0) measurements on gas-phase metallicity (12+log(O/H), left panel) and stellar mass surface density (Σ* right panel) calculated within the same regions. Bottom row: Distributions of metallicity and stellar mass surface density. The histograms show median metallicity and integrated Σ* calculated across the full maps (global, empty black histograms) and tapered maps (beam, grey histograms). The red (blue) dashed lines indicate the median of the global (beam) quantities, while the green dash-dotted line (left panel) shows the solar metallicity (8.69 by Allende Prieto et al. 2001).
Current usage metrics show cumulative count of Article Views (full-text article views including HTML views, PDF and ePub downloads, according to the available data) and Abstracts Views on Vision4Press platform.
Data correspond to usage on the plateform after 2015. The current usage metrics is available 48-96 hours after online publication and is updated daily on week days.
Initial download of the metrics may take a while.