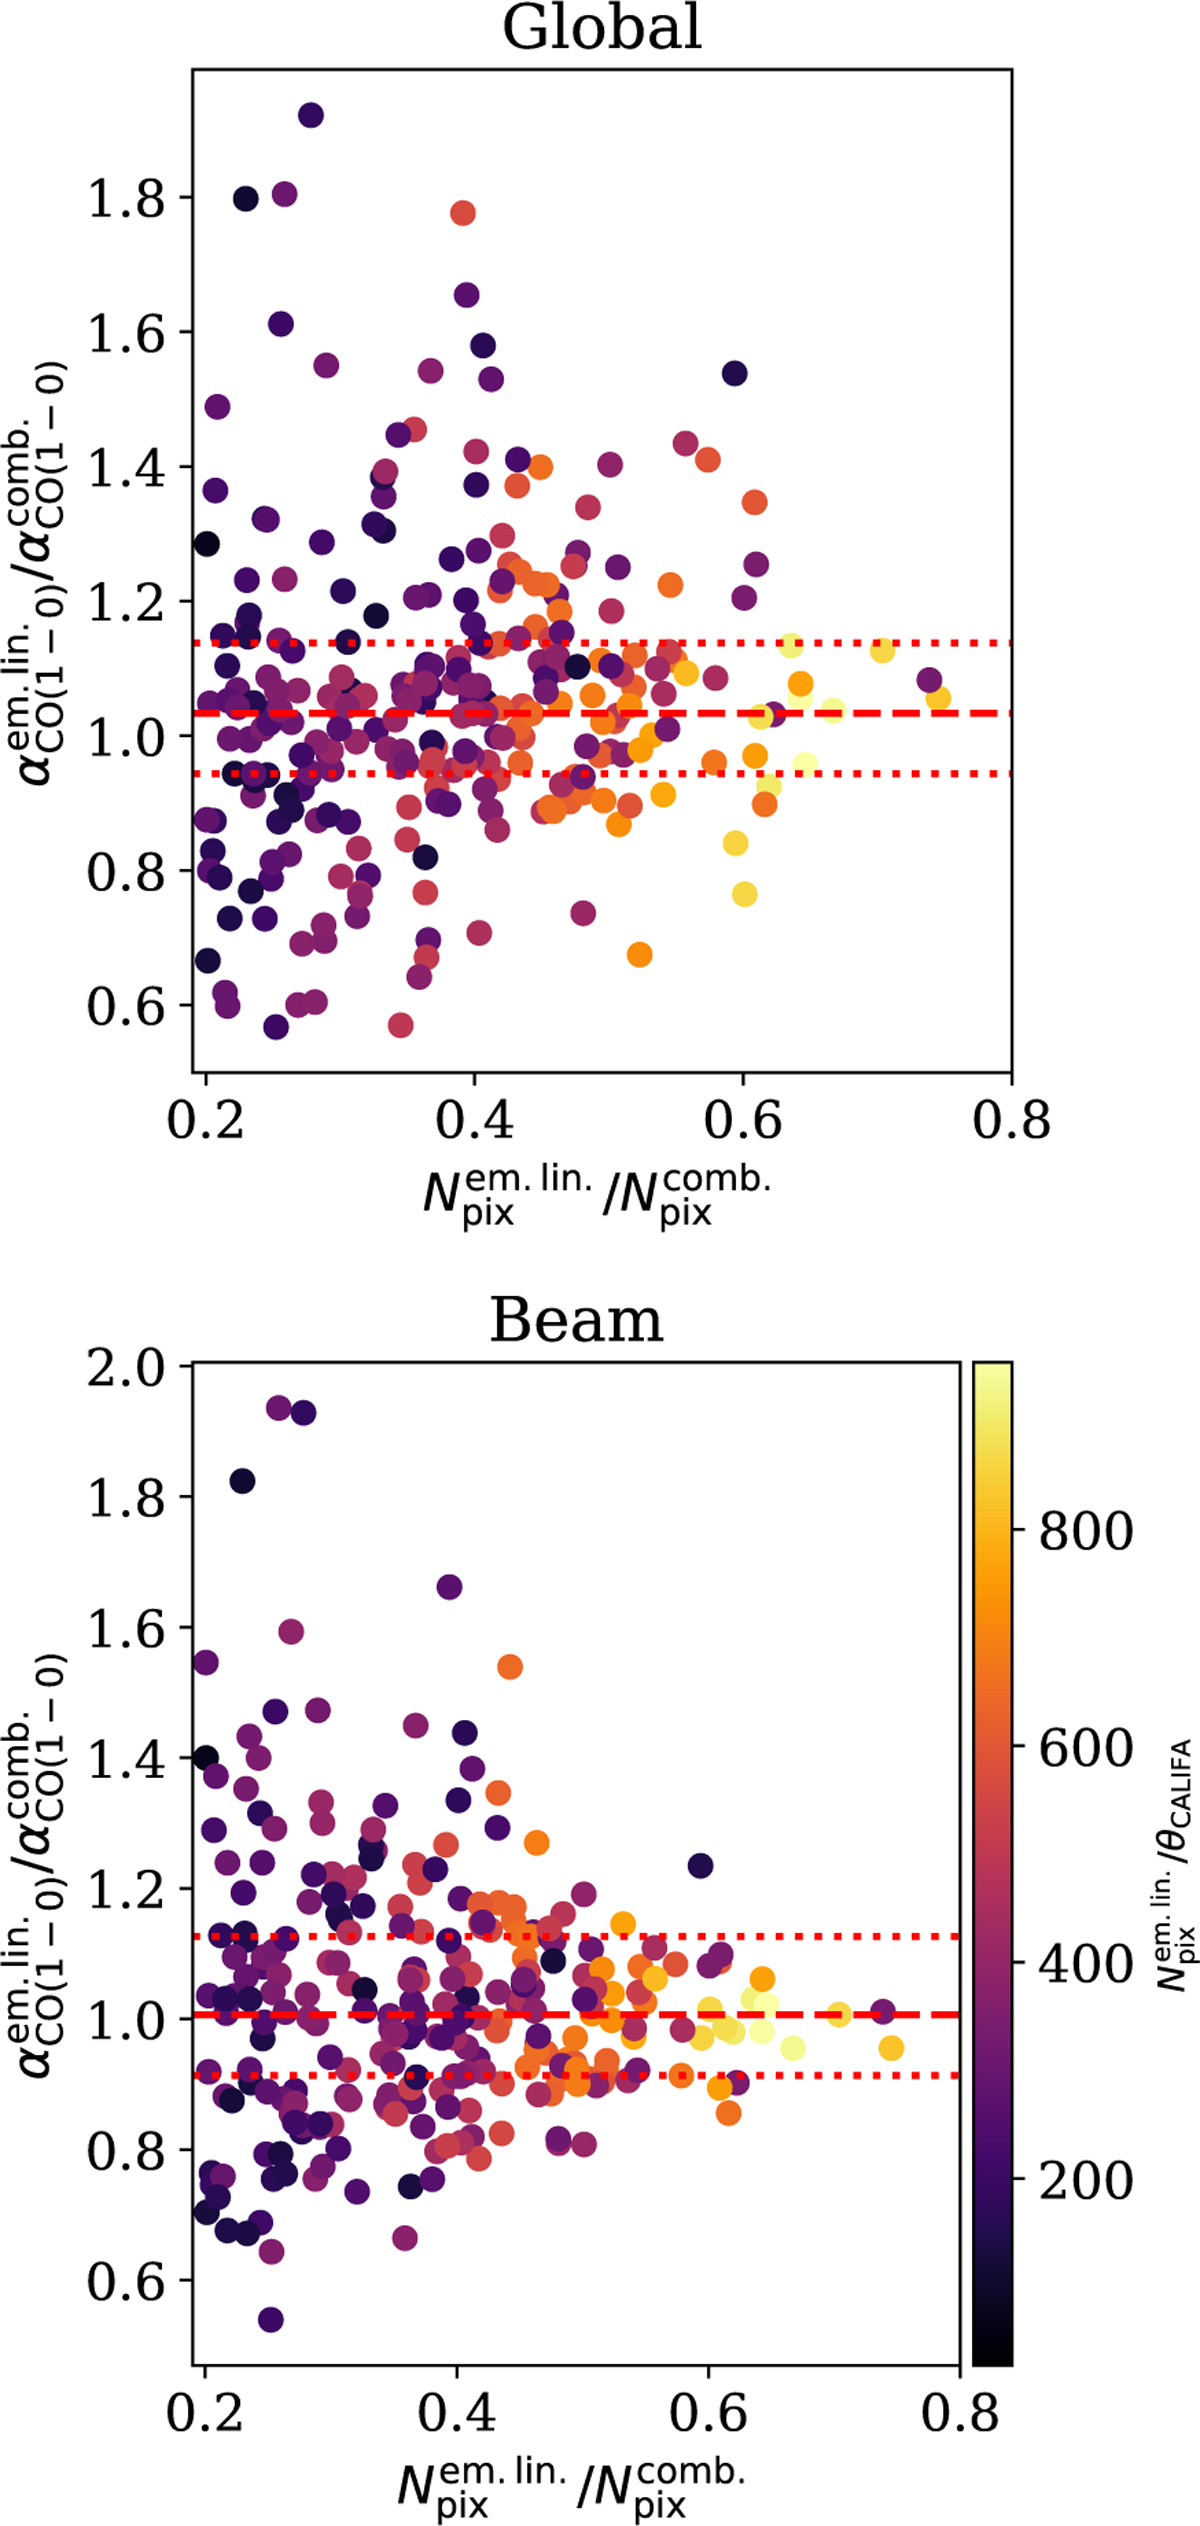
Fig. A.1
Download original image
Ratio of the αCO(1–0) calculated from the gas-phase metallicity inferred only from nebular emission lines (![]() ) to the combined map (
) to the combined map (![]() ) vs the ratio of the number of pixels within the emission lines-map to the number of pixels within the combined map. The colour bar shows the number of resolution elements (θPSF) that constitute the gas-phase metallicity map from the nebular emission lines. The red horizontal lines (from bottom to top) indicate the 25th, 50th, and 75th percentiles of the αCO(1–0) ratio distributions. Additionally, αCO(1–0) values from the left panel come from global measurements, while on the right panels beam measurements are displayed.
) vs the ratio of the number of pixels within the emission lines-map to the number of pixels within the combined map. The colour bar shows the number of resolution elements (θPSF) that constitute the gas-phase metallicity map from the nebular emission lines. The red horizontal lines (from bottom to top) indicate the 25th, 50th, and 75th percentiles of the αCO(1–0) ratio distributions. Additionally, αCO(1–0) values from the left panel come from global measurements, while on the right panels beam measurements are displayed.
Current usage metrics show cumulative count of Article Views (full-text article views including HTML views, PDF and ePub downloads, according to the available data) and Abstracts Views on Vision4Press platform.
Data correspond to usage on the plateform after 2015. The current usage metrics is available 48-96 hours after online publication and is updated daily on week days.
Initial download of the metrics may take a while.