Fig. 1
Download original image
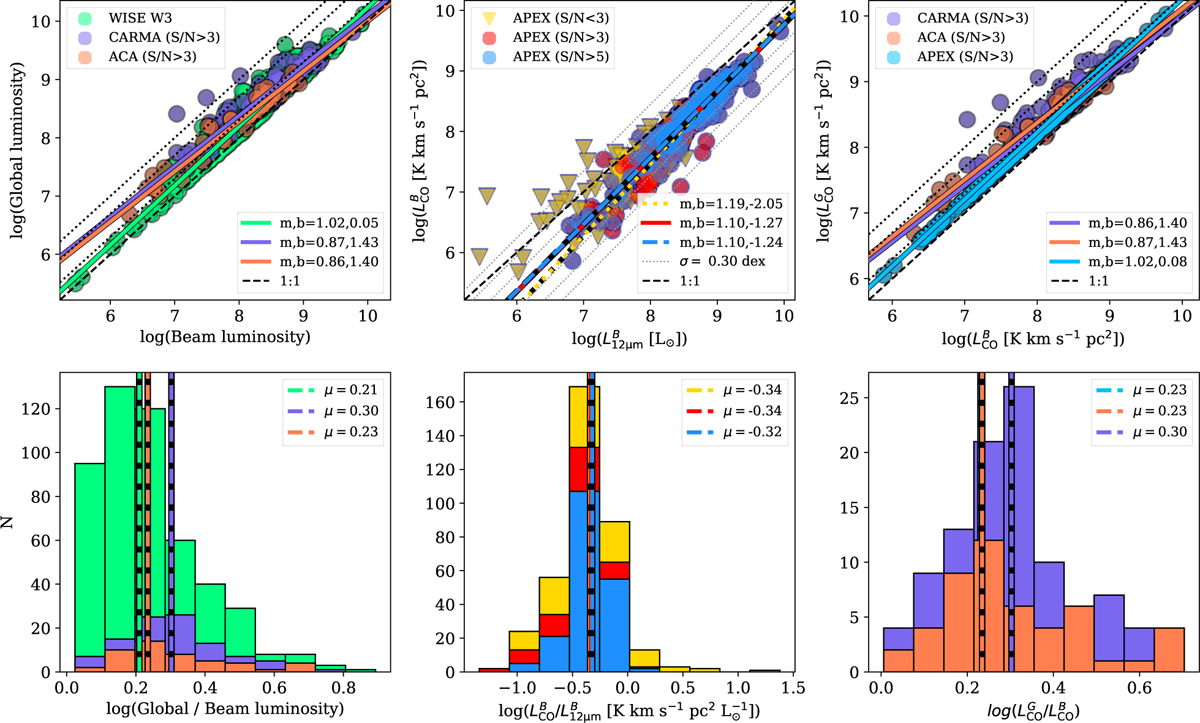
Aperture correction for APEX observation-related tests and measurements. Upper left: global versus beam luminosities calculated for WISE W3 (12 μm; green), ACA (red), and CARMA (blue) detected galaxies. The dotted lines indicate the 2:1, 5:1, and 10:1 loci, respectively. Upper middle: CO(2-1) luminosities from APEX measurements ![]() vs. WISE W3 (12 μm) luminosities
vs. WISE W3 (12 μm) luminosities ![]() calculated within the APEX beam. The blue circles show APEX galaxies detected at 5σRMS, the red circles indicate APEX galaxies detected at 3σRMS, while the yellow triangles show non-detected galaxies (with S/N<3) for which an upper limit of the CO luminosity is used. Upper right: global CO luminosities (
calculated within the APEX beam. The blue circles show APEX galaxies detected at 5σRMS, the red circles indicate APEX galaxies detected at 3σRMS, while the yellow triangles show non-detected galaxies (with S/N<3) for which an upper limit of the CO luminosity is used. Upper right: global CO luminosities (![]() ) vs beam CO luminosities (
) vs beam CO luminosities (![]() ) for ACA (red), CARMA (blue), and APEX (cyan). For the last, global luminosities are inferred from the aperture correction given by Equation (4). In the upper panels, fits to the data obtained through the linmix method (see Section 4 for further details) are indicated with full lines using the same colours as the samples. Fit parameters, such as slope (m) and intercept (b), are also reported in the legend. Additionally, the 1:1 locus is indicated by a dashed black line. In the lower panels, the histograms for the ratios related to the quantities and the samples in the corresponding upper panels are shown, together with the median of the distributions indicated with dashed lines. We can conclude that the global CO luminosities inferred from APEX data using the aperture correction procedure that involves 12 μm data is roughly a factor 1.7 higher than the measured beam CO luminosities. This ratio is consistent with the
) for ACA (red), CARMA (blue), and APEX (cyan). For the last, global luminosities are inferred from the aperture correction given by Equation (4). In the upper panels, fits to the data obtained through the linmix method (see Section 4 for further details) are indicated with full lines using the same colours as the samples. Fit parameters, such as slope (m) and intercept (b), are also reported in the legend. Additionally, the 1:1 locus is indicated by a dashed black line. In the lower panels, the histograms for the ratios related to the quantities and the samples in the corresponding upper panels are shown, together with the median of the distributions indicated with dashed lines. We can conclude that the global CO luminosities inferred from APEX data using the aperture correction procedure that involves 12 μm data is roughly a factor 1.7 higher than the measured beam CO luminosities. This ratio is consistent with the ![]() ratio measured from ACA data, while the average ratio from CARMA galaxies is slightly higher, ~2.
ratio measured from ACA data, while the average ratio from CARMA galaxies is slightly higher, ~2.
Current usage metrics show cumulative count of Article Views (full-text article views including HTML views, PDF and ePub downloads, according to the available data) and Abstracts Views on Vision4Press platform.
Data correspond to usage on the plateform after 2015. The current usage metrics is available 48-96 hours after online publication and is updated daily on week days.
Initial download of the metrics may take a while.