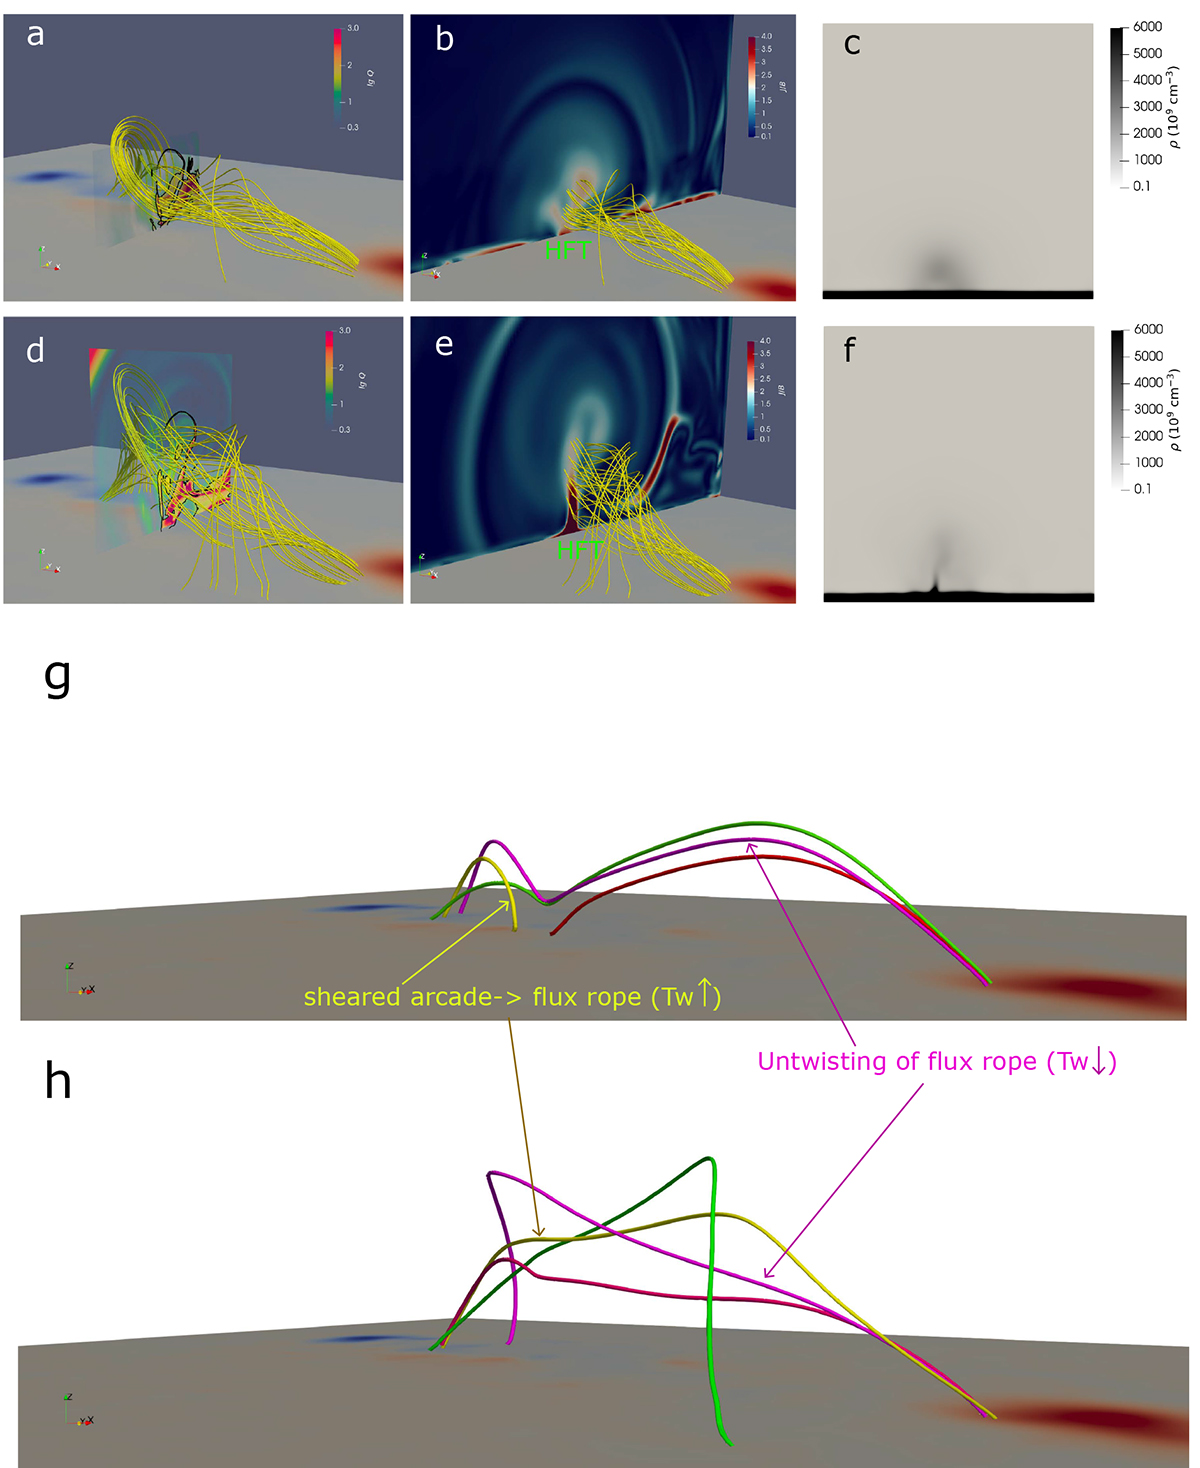
Fig. 9.
Download original image
QSLs, electric current density (J/B ), and gas pressure (ρ) distribution of the flux rope cross-section plane at 1 (top panels) and 3 unit times (τ). The yellow lines in panels a–f show the flux rope. The pink and green and yellow and red lines in panels g and h represent flux-rope and sheared-arcade field lines at t = 3 τ, respectively.
Current usage metrics show cumulative count of Article Views (full-text article views including HTML views, PDF and ePub downloads, according to the available data) and Abstracts Views on Vision4Press platform.
Data correspond to usage on the plateform after 2015. The current usage metrics is available 48-96 hours after online publication and is updated daily on week days.
Initial download of the metrics may take a while.