Open Access
Fig. 7.
Download original image
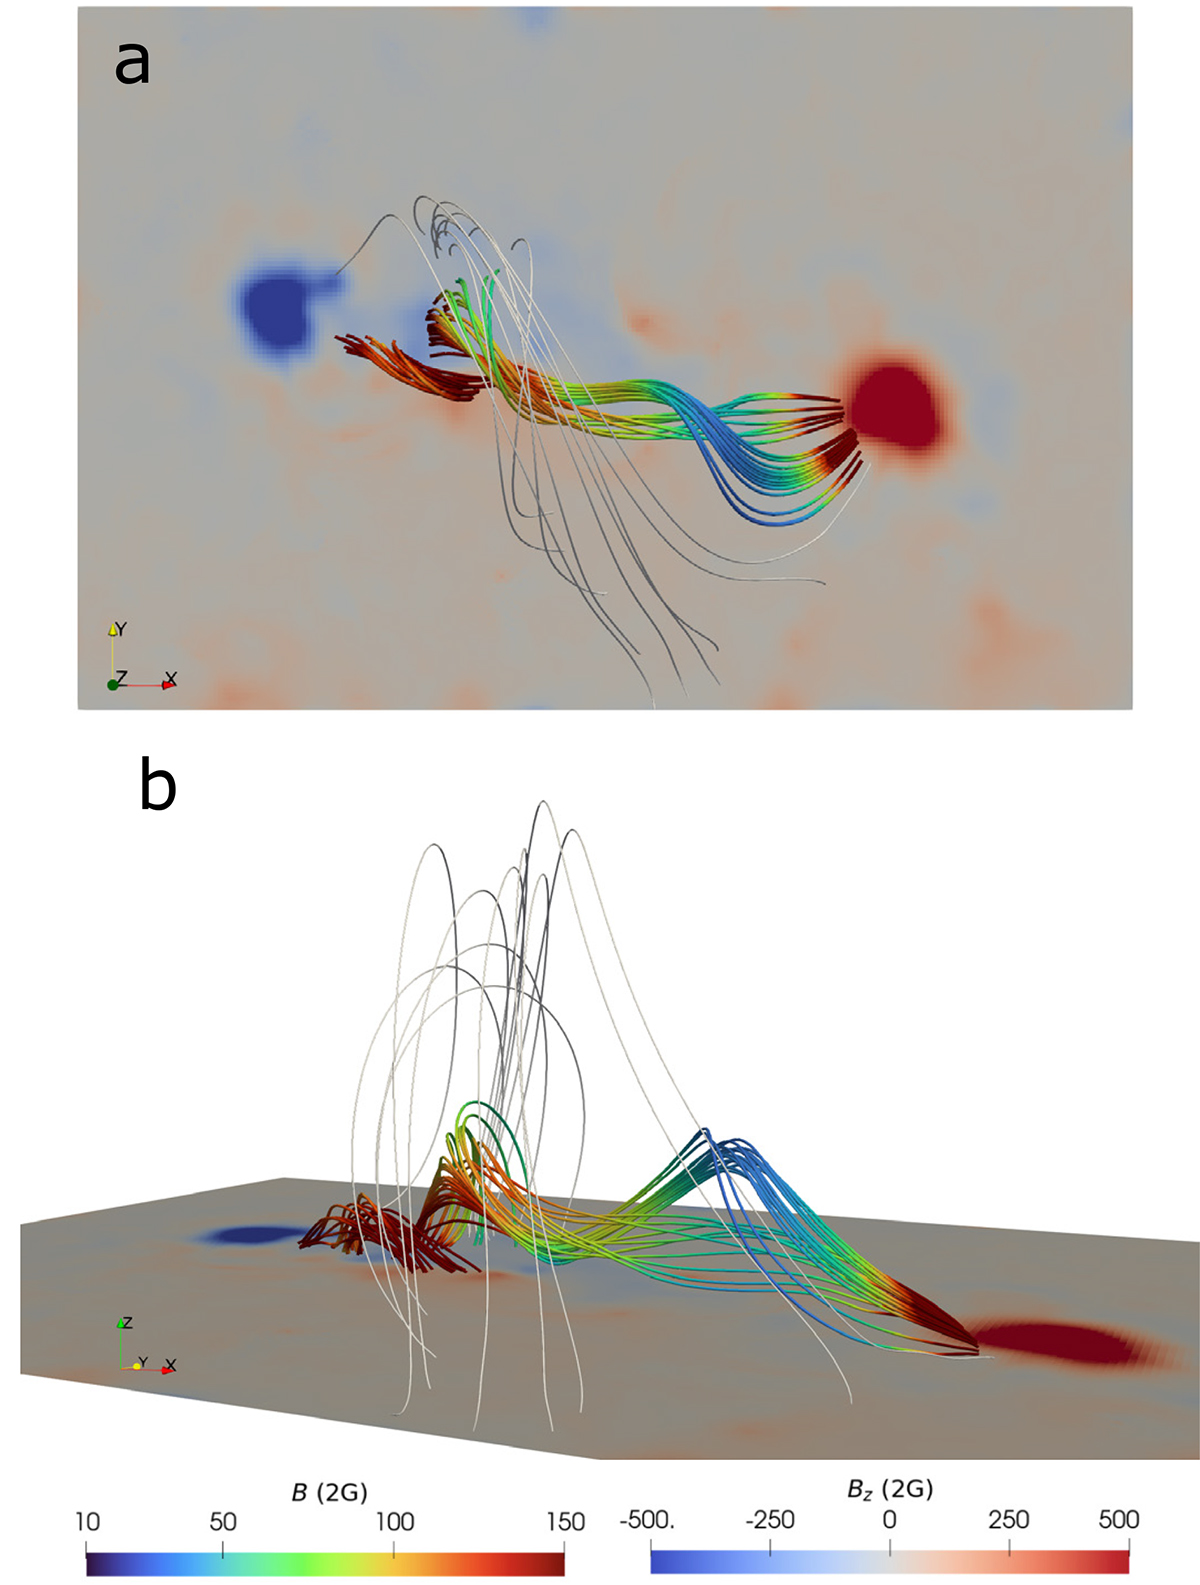
NLFFF extrapolation based on the SDO/HMI vector magnetogram observed at 07:24 UT (panel a shows a view from above, and panel b shows a side view). The colors of lines (black to red) represent the magnetic field strengths, and the colors in the bottom plane (blue to red) show the distribution of Bz.
Current usage metrics show cumulative count of Article Views (full-text article views including HTML views, PDF and ePub downloads, according to the available data) and Abstracts Views on Vision4Press platform.
Data correspond to usage on the plateform after 2015. The current usage metrics is available 48-96 hours after online publication and is updated daily on week days.
Initial download of the metrics may take a while.