Fig. 6.
Download original image
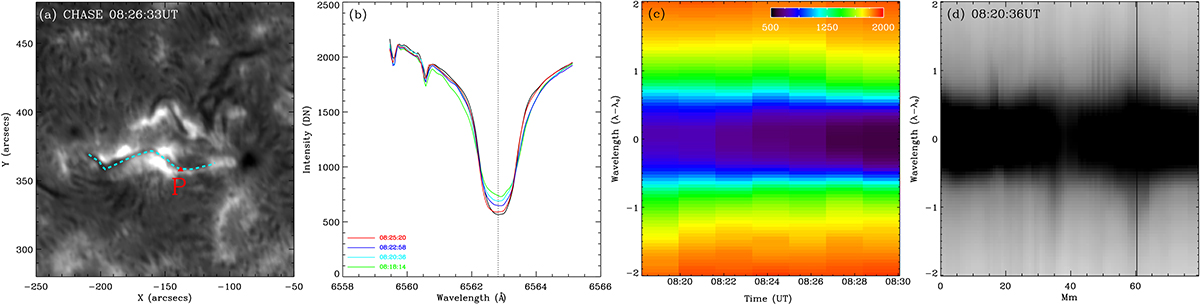
Observation of CHASE at 08:26:33 UT. The dashed cyan line represents the path along the spine of the filament, and a red point P is on it. Spectrum profiles of point P at different times are shown in panel (b), and the black line represents the line profile of the quiet region. Panel (c) shows the spectrum-time diagram of point P. Panel (d) shows the spectrum along the path at 08:20:36 UT. The vertical black line represents the position of point P.
Current usage metrics show cumulative count of Article Views (full-text article views including HTML views, PDF and ePub downloads, according to the available data) and Abstracts Views on Vision4Press platform.
Data correspond to usage on the plateform after 2015. The current usage metrics is available 48-96 hours after online publication and is updated daily on week days.
Initial download of the metrics may take a while.