Fig. 5.
Download original image
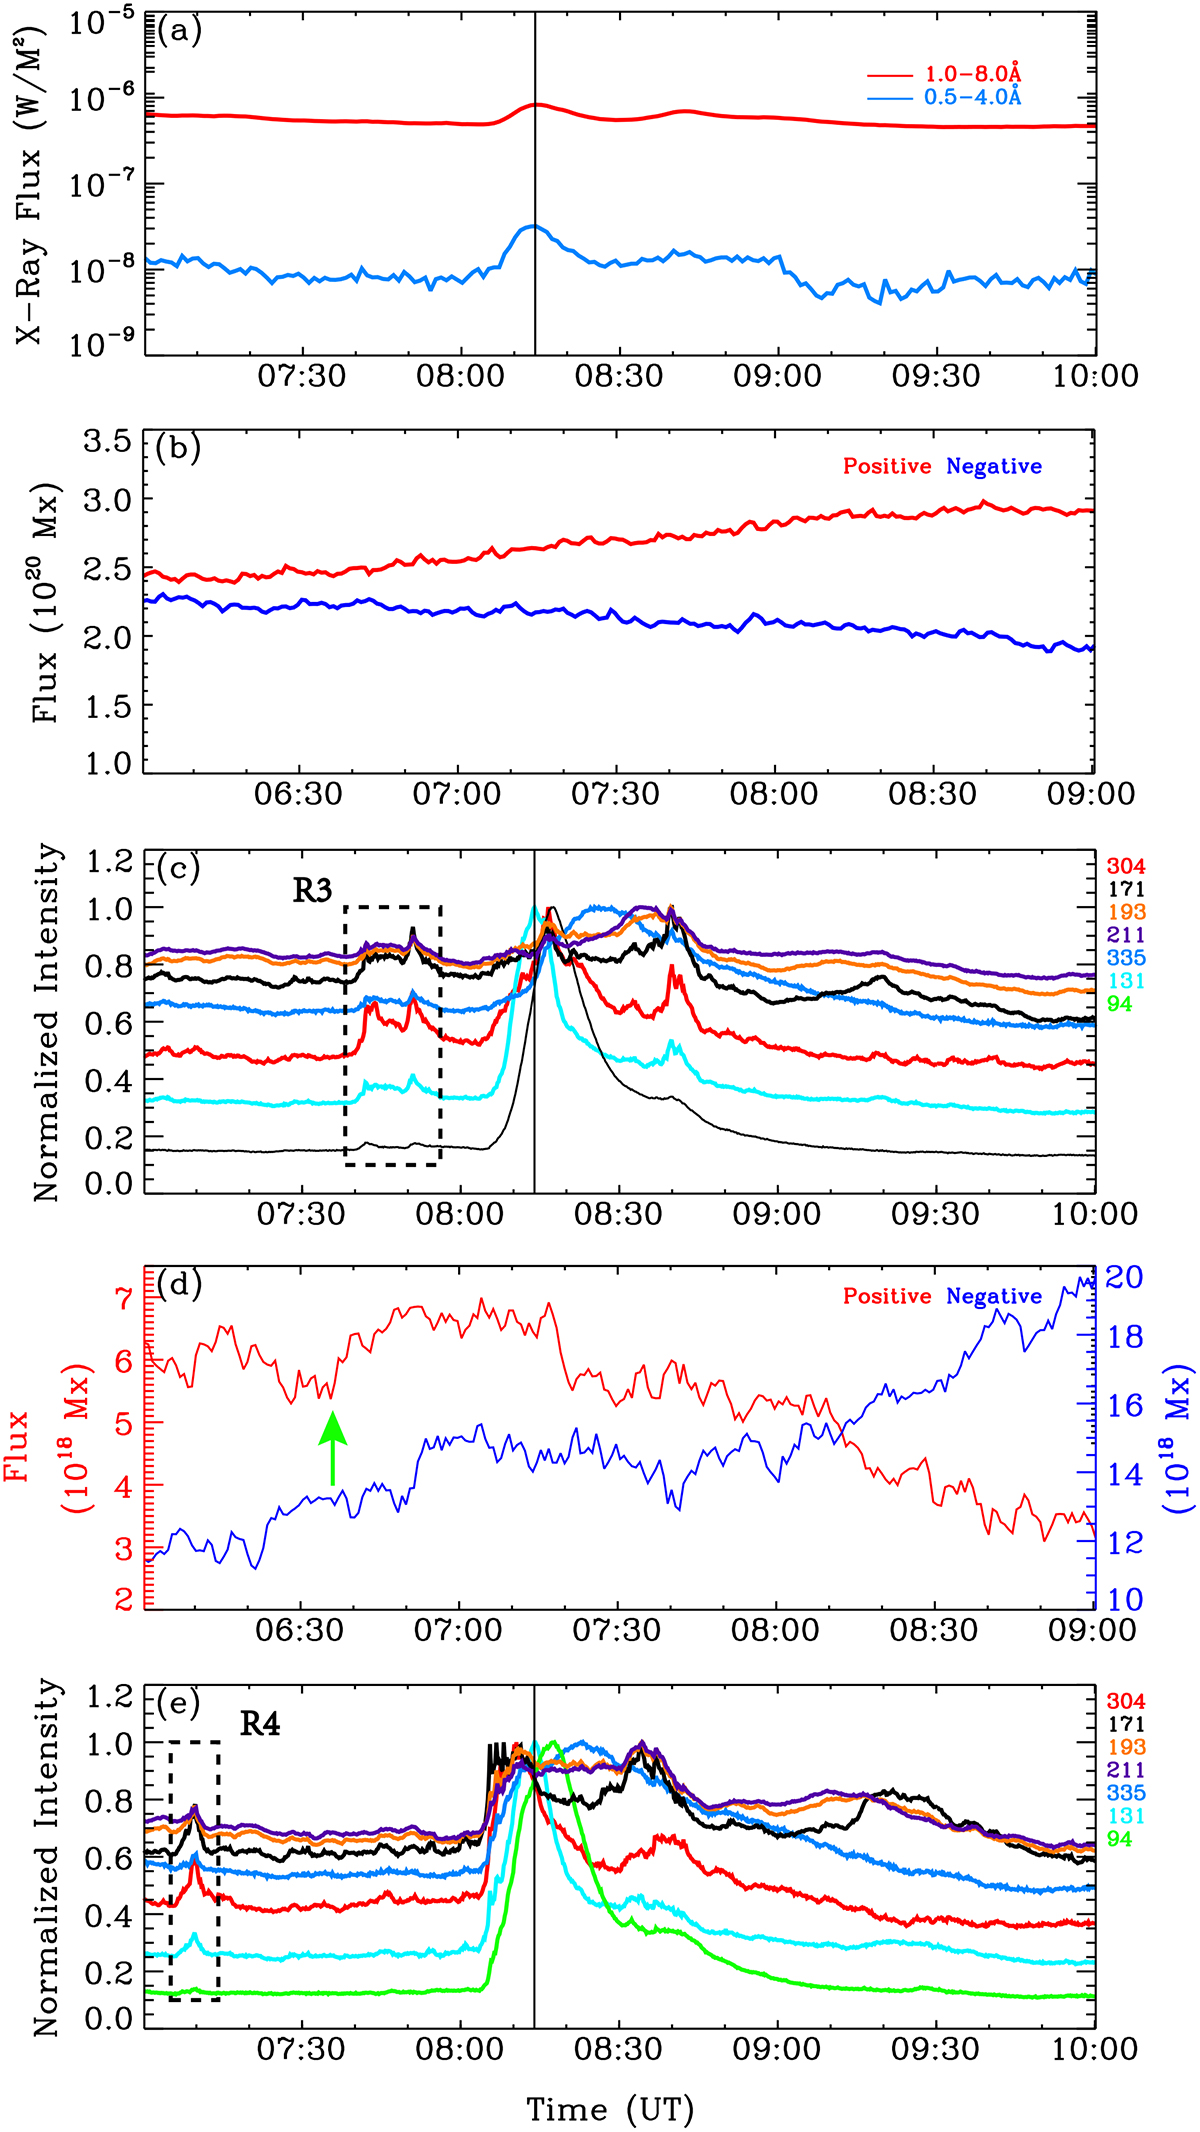
Panel (a) shows the GOES SXR 0.5–4.0 Å and 1–8 Å flux variation and reveals the B8.4 flare. Panels (b) and (d) show the magnetic flux evolution of R1 and R2 (marked by orange and blue boxes in Figures 1 and 2), respectively. The positive (red) and negative (blue) flux are plotted. Panels (c) and (e) show light curves of the EUV channels in R1 and R2 using different colors. The vertical black line represents the peak time of the flare. The green arrow and R4 stand for the time of disturbance of the middle part of the filament. Panel (b) shares a common y-axis for the positive and negative magnetic flux. In panel (d), the values of positive and negative magnetic flux differ significantly, so that the positive values use the left y-axis and the negative values use the right y-axis. R3 covers the time of the untwisting motion of the right branch of the filament before the flare.
Current usage metrics show cumulative count of Article Views (full-text article views including HTML views, PDF and ePub downloads, according to the available data) and Abstracts Views on Vision4Press platform.
Data correspond to usage on the plateform after 2015. The current usage metrics is available 48-96 hours after online publication and is updated daily on week days.
Initial download of the metrics may take a while.