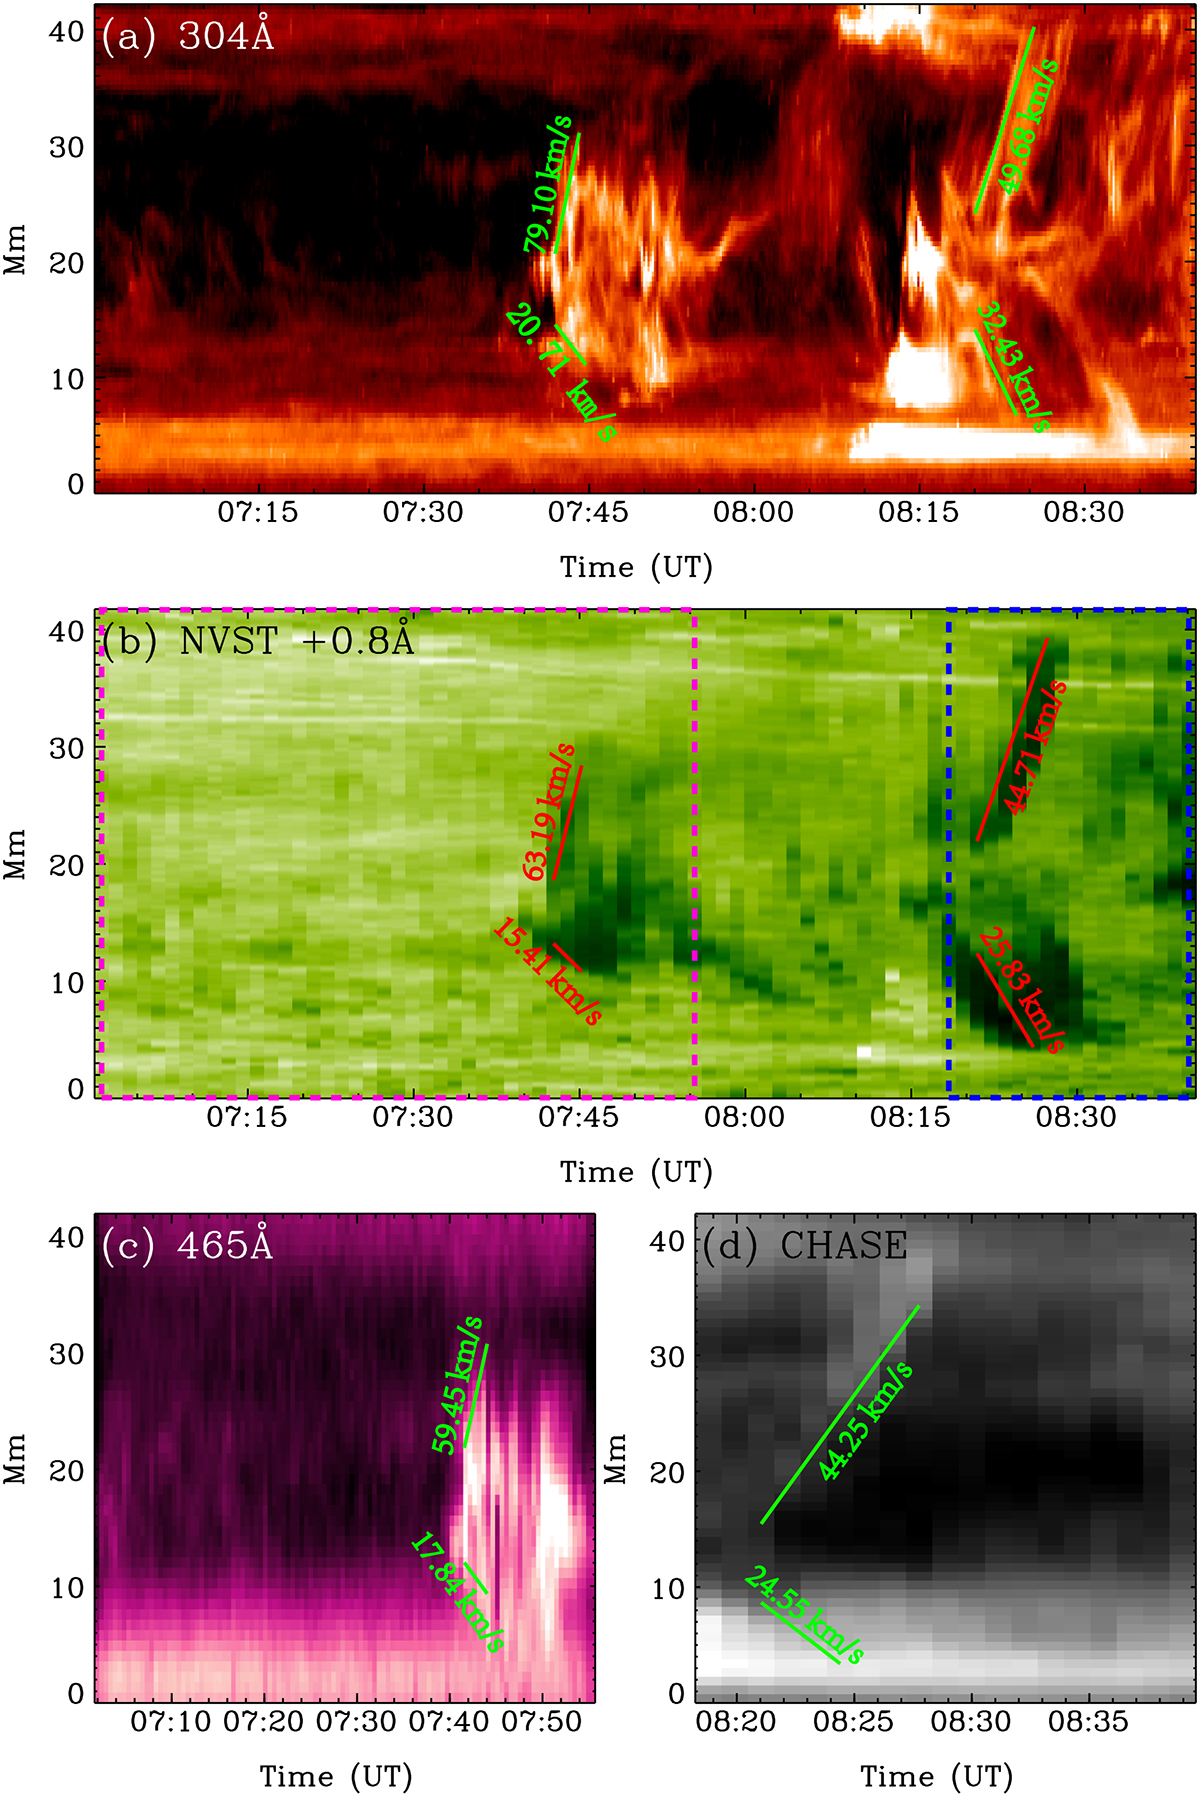
Fig. 4.
Download original image
Time–distance diagrams along the filament (S2 slice shown in Figure 3a) in AIA 304 Å, in NVST Hα, in SUTRI 465 Å, and in CHASE Hα intensity images. They show bidirectional outflows during the filament evolution. The flow velocities are overlaid on the diagrams. The dashed magenta box represents the time range of SUTRI 465 Å, and the dashed blue box shows the time range of CHASE Hα in panel (b).
Current usage metrics show cumulative count of Article Views (full-text article views including HTML views, PDF and ePub downloads, according to the available data) and Abstracts Views on Vision4Press platform.
Data correspond to usage on the plateform after 2015. The current usage metrics is available 48-96 hours after online publication and is updated daily on week days.
Initial download of the metrics may take a while.