Fig. 3.
Download original image
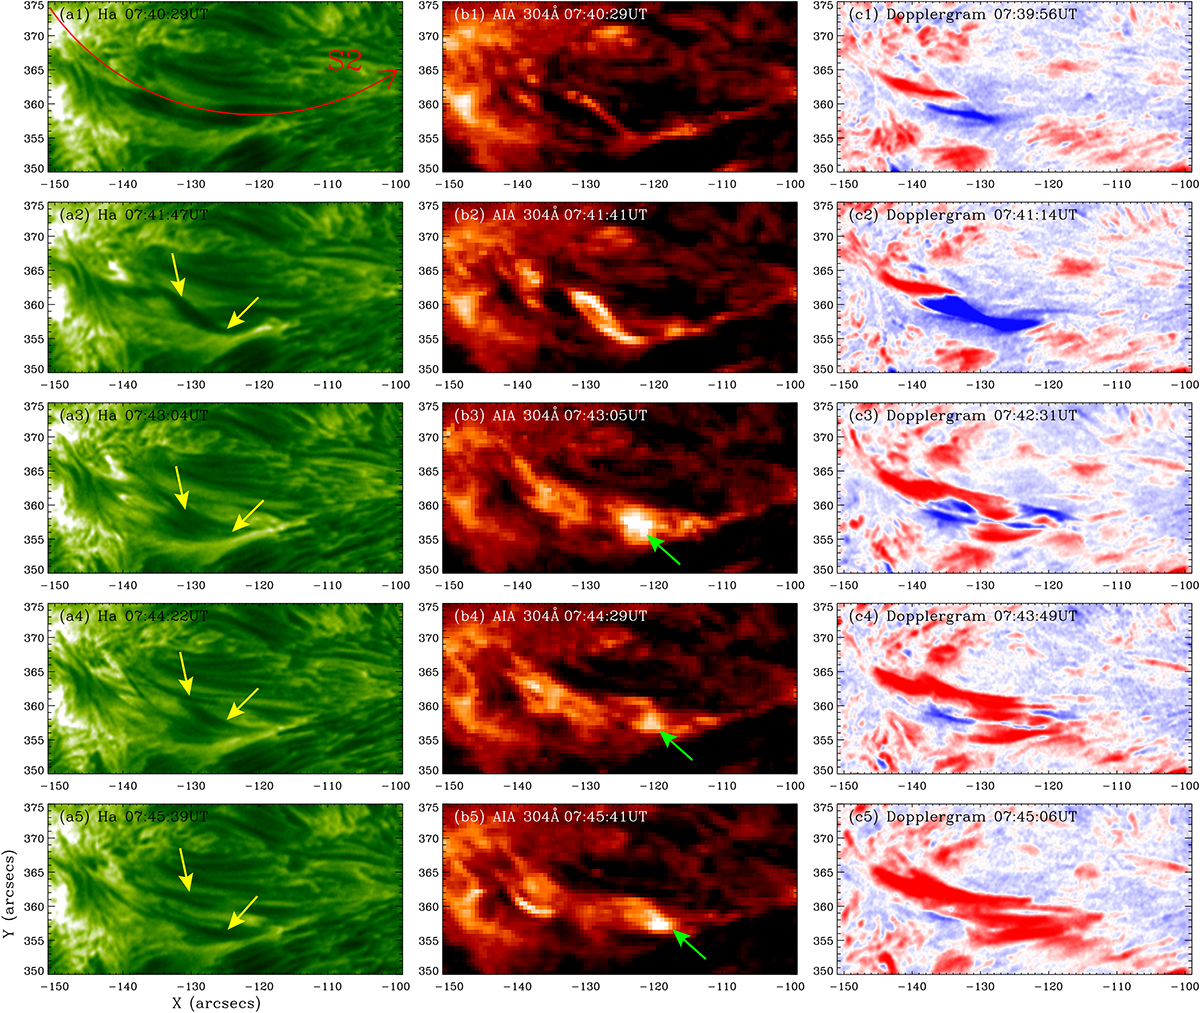
Untwisting motion evolution of the filament, right branch, observed by the NVST in the Hα line center and by AIA in 304 Å between 07:40 UT and 07:45 UT before the flare. The yellow arrows indicate the threads that untwist and become loose. The observations of NVST are presented in panels (a1)–(a5), in 304 Å in panels (b1)–(b5), reconstructed Dopplergrams in panels (c1)–(c5) (blue and red correspond to blue- and redshift). The curved red arrow in panel (a) represents slice S2, along which the plasma flows. The green arrows in the 304 images indicate the brightening blobs that move west.
Current usage metrics show cumulative count of Article Views (full-text article views including HTML views, PDF and ePub downloads, according to the available data) and Abstracts Views on Vision4Press platform.
Data correspond to usage on the plateform after 2015. The current usage metrics is available 48-96 hours after online publication and is updated daily on week days.
Initial download of the metrics may take a while.