Fig. 2.
Download original image
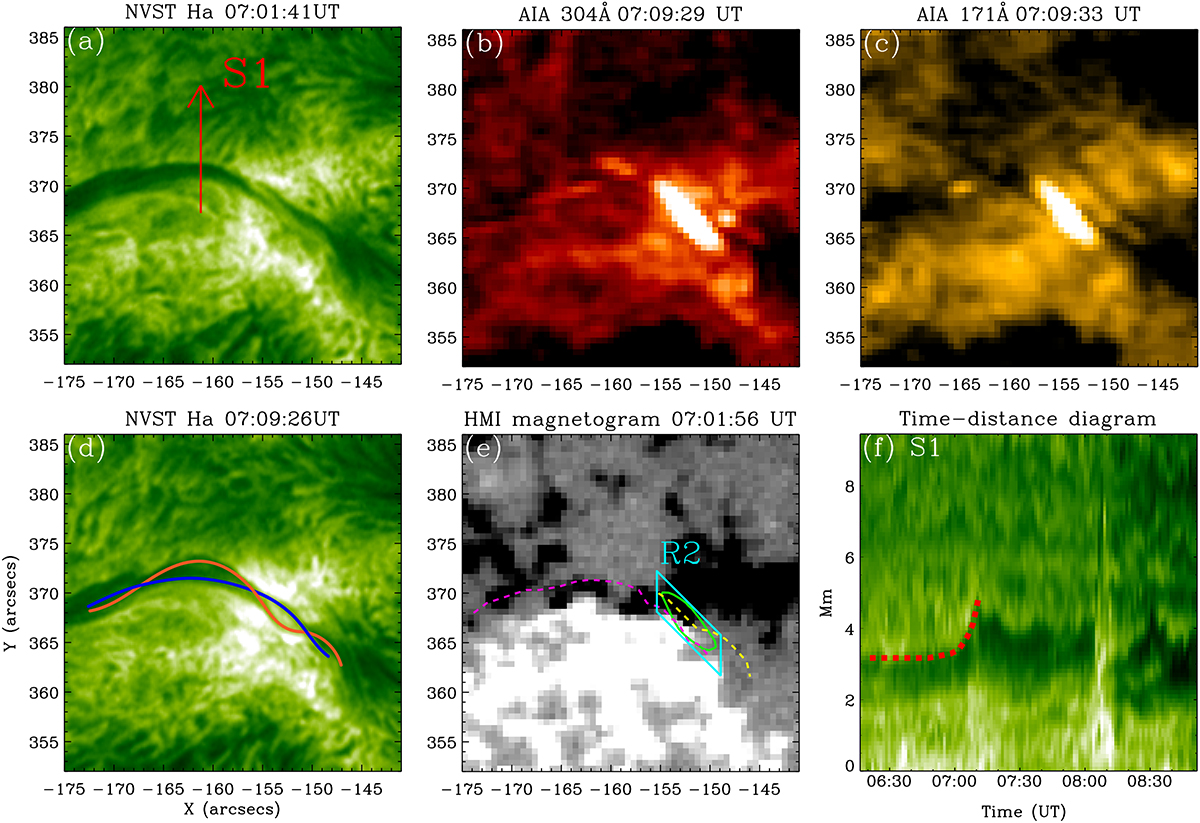
Temporal evolution of the middle part of filament at two times (panel a at 07:01:41 UT and panel d at 07:09:26 UT): Zoom of the central NVST image in Hα of Figure 1. The NVST intensity of Hα is shown in green. In panel (d) the blue and orange lines represent the composition of the magnetic flux rope after magnetic reconnection. Panels (b) and (c) show the corresponding brightening in the AIA 304 Åand 171 Å images. Panel (e) shows the corresponding magnetogram. The dashed magenta and yellow lines represent the interacting threads at 07:01:41 UT. The green contour represents the brightening of 304 Å at 07:09:29 UT. The cyan box (R2) represents the area of the calculated magnetic flux shown in Figure 5. In panel (f) we show the time–distance diagram of the slice S1 shown in panel (a). The movement of the threads is indicated by the dashed red line.
Current usage metrics show cumulative count of Article Views (full-text article views including HTML views, PDF and ePub downloads, according to the available data) and Abstracts Views on Vision4Press platform.
Data correspond to usage on the plateform after 2015. The current usage metrics is available 48-96 hours after online publication and is updated daily on week days.
Initial download of the metrics may take a while.