Fig. A.1.
Download original image
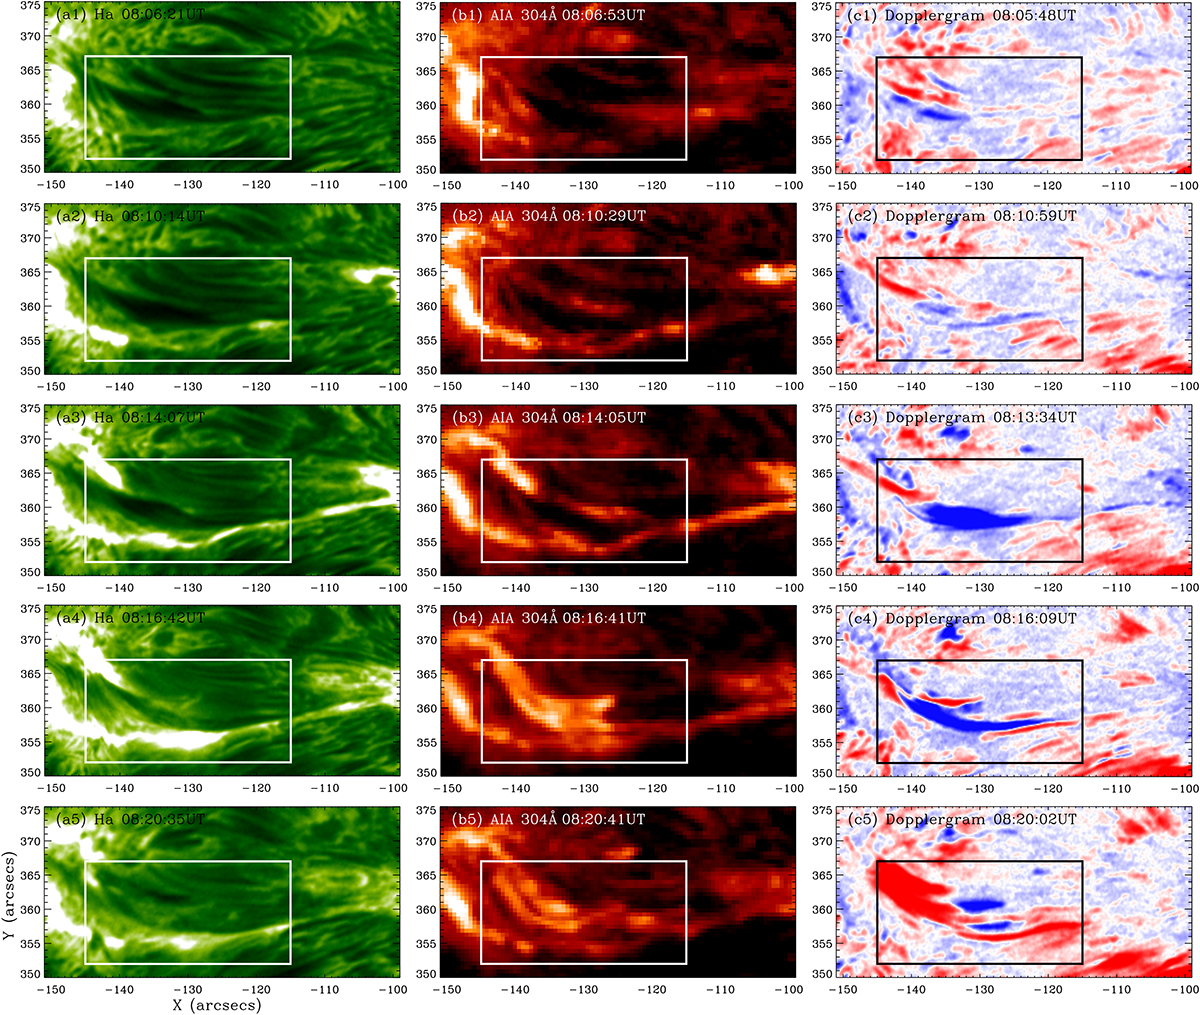
Evolution of the right branch of the filament, observed by the NVST in the Hα line center (panels (a1)–(a5)) and in 304 Å (panels (b1)–(b5)) between 08:06 UT and 08:20 UT. The reconstructed Dopplergrams in panels (c1)–(c5) show bidirectional outflows after the flare. Black and white box indicate the blueshifted intrusion region in the middle of the right branch of the filament.
Current usage metrics show cumulative count of Article Views (full-text article views including HTML views, PDF and ePub downloads, according to the available data) and Abstracts Views on Vision4Press platform.
Data correspond to usage on the plateform after 2015. The current usage metrics is available 48-96 hours after online publication and is updated daily on week days.
Initial download of the metrics may take a while.