Fig. 1.
Download original image
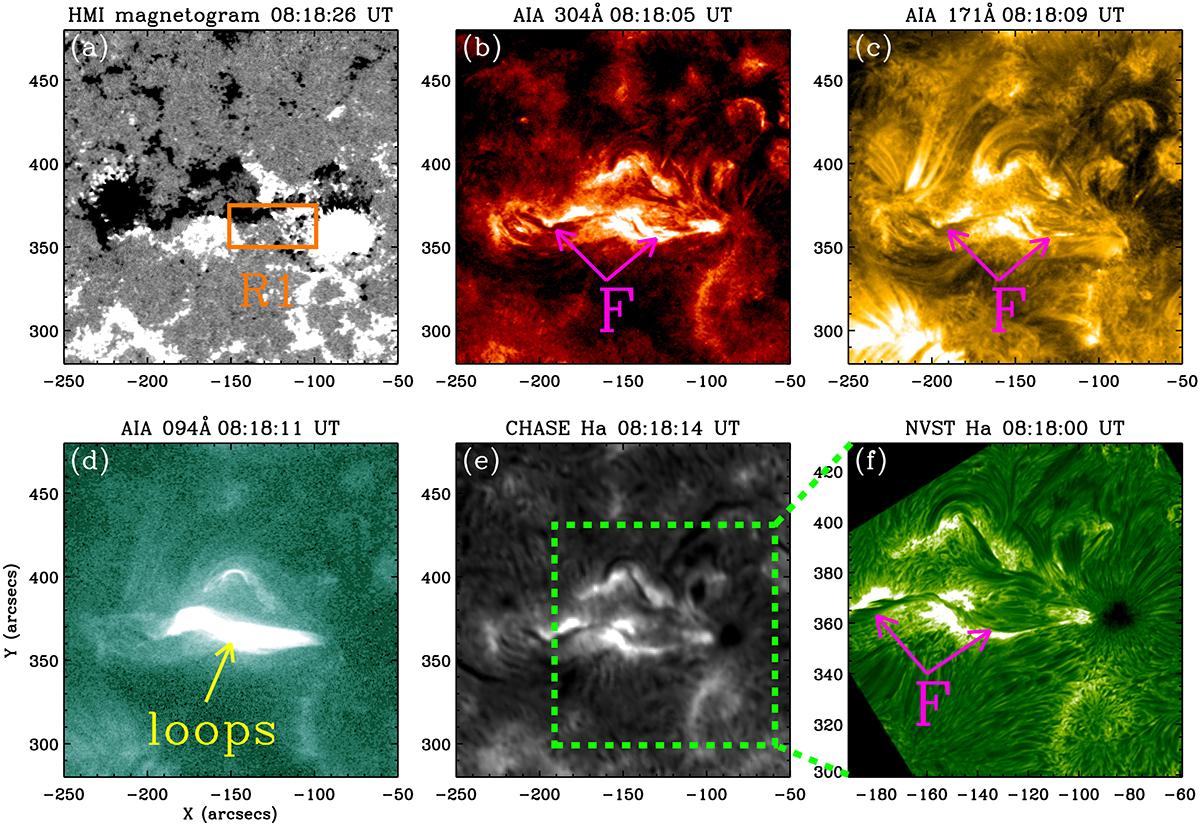
Overview of multiwavelength observations in active region AR 13135. Panels (a)–(d) show a map of the magnetic field (HMI) and three intensity maps in 304 Å, 171 Å, and 94 Å from AIA. Panel (e) and panel (f) show Hα observations of CHASE in black and white and NVST in green, respectively. The Hα observation of NVST is the enlarged area of the dashed green box in panel (e). The orange box in the magnetogram (panel a) indicates the region of the right branch of the filament (box R1). The position of the filament is indicated by magenta arrows F in panel b and coronal loops by a yellow arrow in panel d. The associated movie is available online (aa53071-24movie.mp4).
Current usage metrics show cumulative count of Article Views (full-text article views including HTML views, PDF and ePub downloads, according to the available data) and Abstracts Views on Vision4Press platform.
Data correspond to usage on the plateform after 2015. The current usage metrics is available 48-96 hours after online publication and is updated daily on week days.
Initial download of the metrics may take a while.