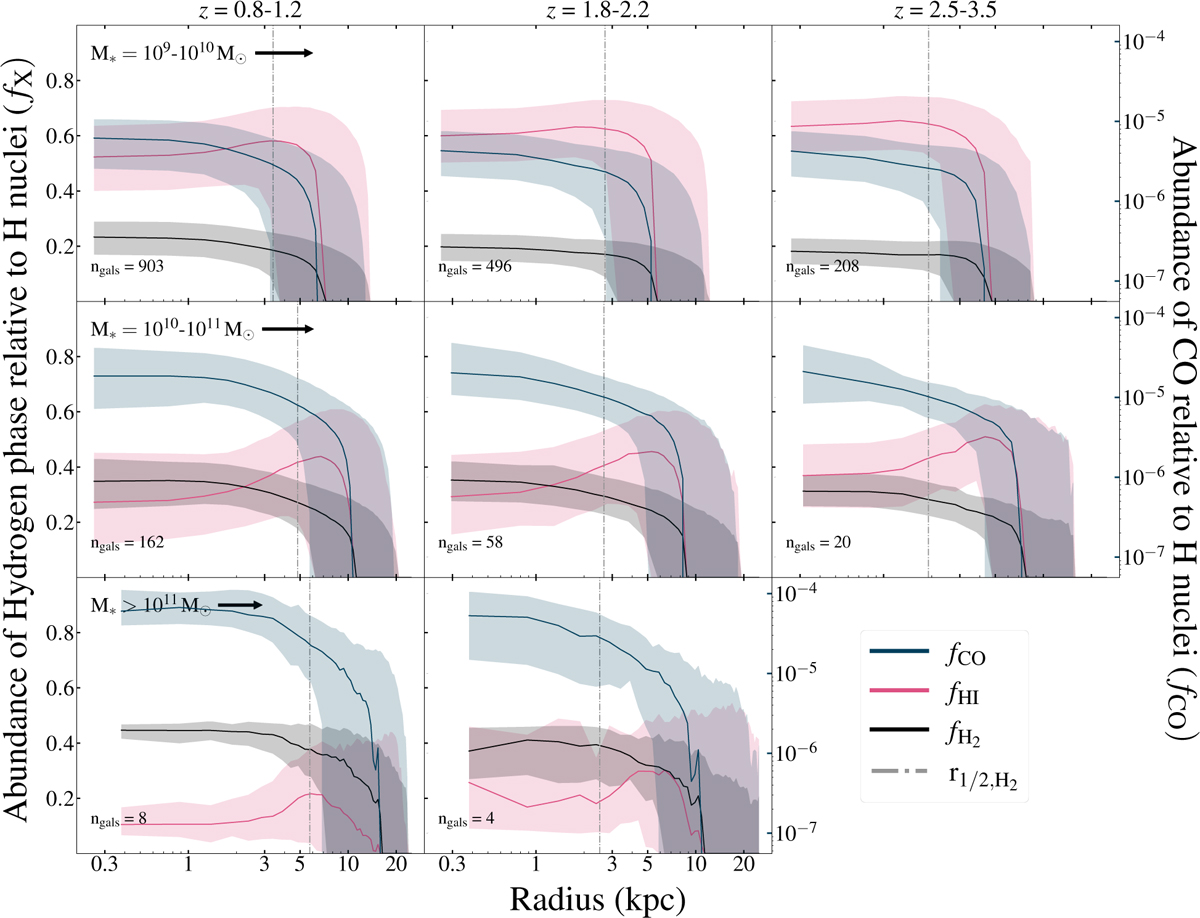
Fig. 9

Download original image
Average radial profile of abundances of HI, H2 (left axis), and CO (right axis) per H nucleus. The profiles are shown in the same bins of redshift (columns) and stellar mass (rows) as Figs. 3–5. The solid lines represent the median relative abundances, averaged across the entire galaxy sample corresponding to each panel, while the shaded regions indicate the 16th to 84th percentiles of the values at each radial bin. The three species are color-coded as shown in the legend at the bottom right. Note that the maximum possible value for HI would be 1 (i.e., fully atomic), but for H2 would be 0.5 (i.e., fully molecular).
Current usage metrics show cumulative count of Article Views (full-text article views including HTML views, PDF and ePub downloads, according to the available data) and Abstracts Views on Vision4Press platform.
Data correspond to usage on the plateform after 2015. The current usage metrics is available 48-96 hours after online publication and is updated daily on week days.
Initial download of the metrics may take a while.


