Fig. 8
Download original image
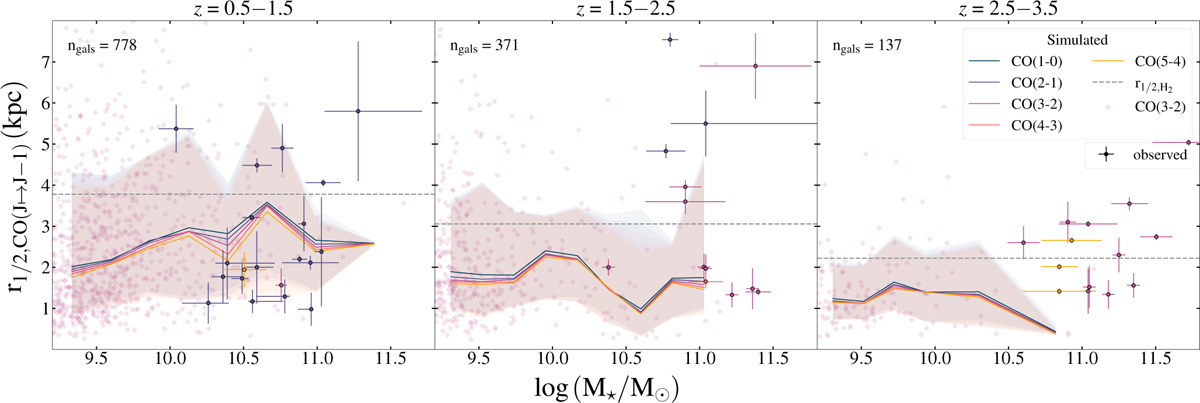
CO half-light radii as a function of galaxy stellar mass, in three redshift bins (one for each panel, as labelled at top), for both the simulated galaxies (line and shaded region) and observed galaxies. Median values are shown as solid lines, whereas the spread; that is, 16th–84th percentiles, are shown as shaded regions. Given the similarity between the half-light radii of the different CO transitions, we only show r1/2,CO(3−2) of all galaxies as diamonds for clarity (see legend at right). Our predictions are compared to CO sizes measured from observations by Kaasinen et al. (2020); Ikeda et al. (2022); Rizzo et al. (2023); Tadaki et al. (2023).
Current usage metrics show cumulative count of Article Views (full-text article views including HTML views, PDF and ePub downloads, according to the available data) and Abstracts Views on Vision4Press platform.
Data correspond to usage on the plateform after 2015. The current usage metrics is available 48-96 hours after online publication and is updated daily on week days.
Initial download of the metrics may take a while.