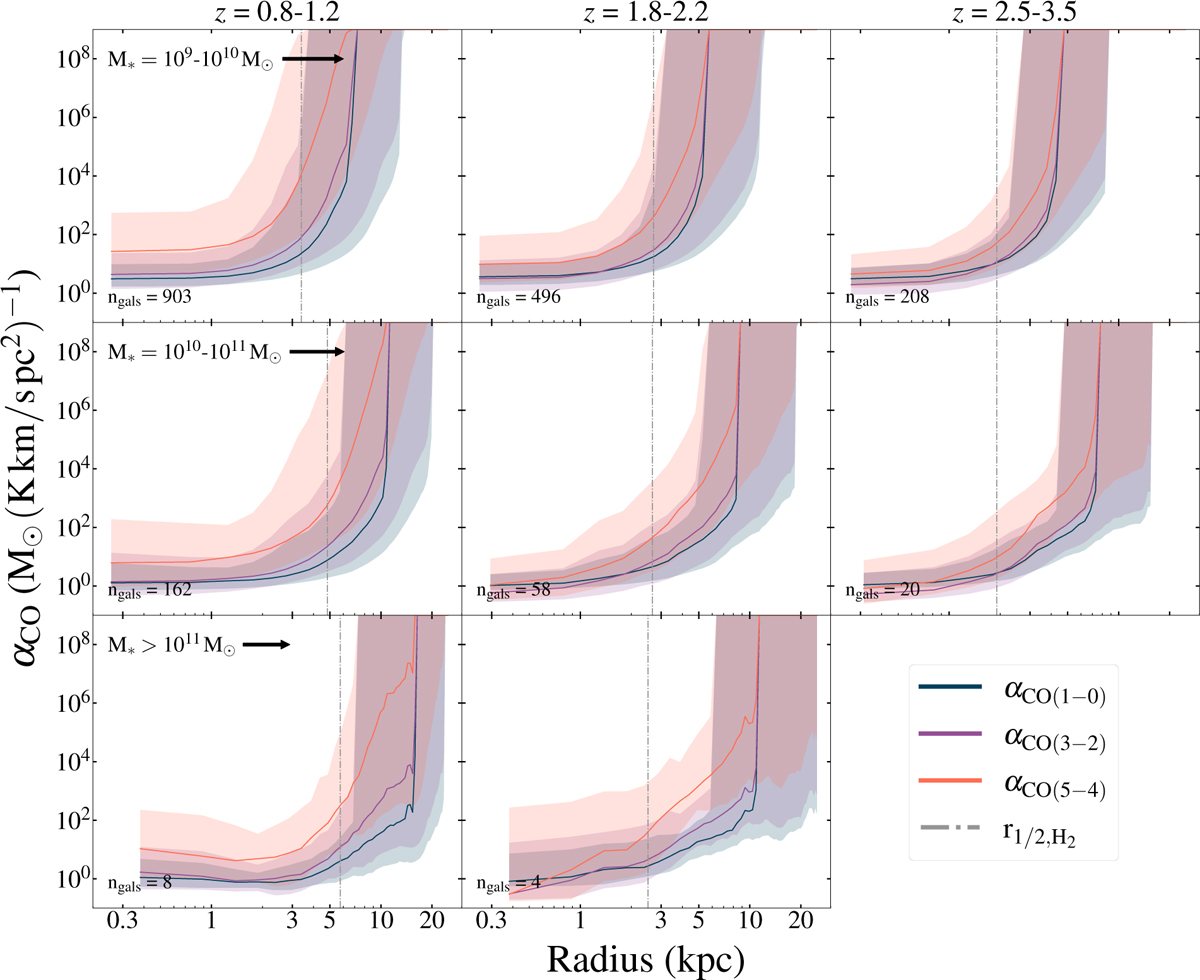
Fig. 4
Download original image
Average radial profile of the CO-to-H2 conversion factor (αCO), for different transitions (shown in the legend on the right). The x-axis is plotted in log scale. The solid lines represent the median αCO, averaged across the entire galaxy sample shown in each panel. The shaded regions encompass the 16th and 84th percentiles of the values at each radius. The columns and rows indicate the same redshift, and stellar mass bins as in Fig. 3.
Current usage metrics show cumulative count of Article Views (full-text article views including HTML views, PDF and ePub downloads, according to the available data) and Abstracts Views on Vision4Press platform.
Data correspond to usage on the plateform after 2015. The current usage metrics is available 48-96 hours after online publication and is updated daily on week days.
Initial download of the metrics may take a while.