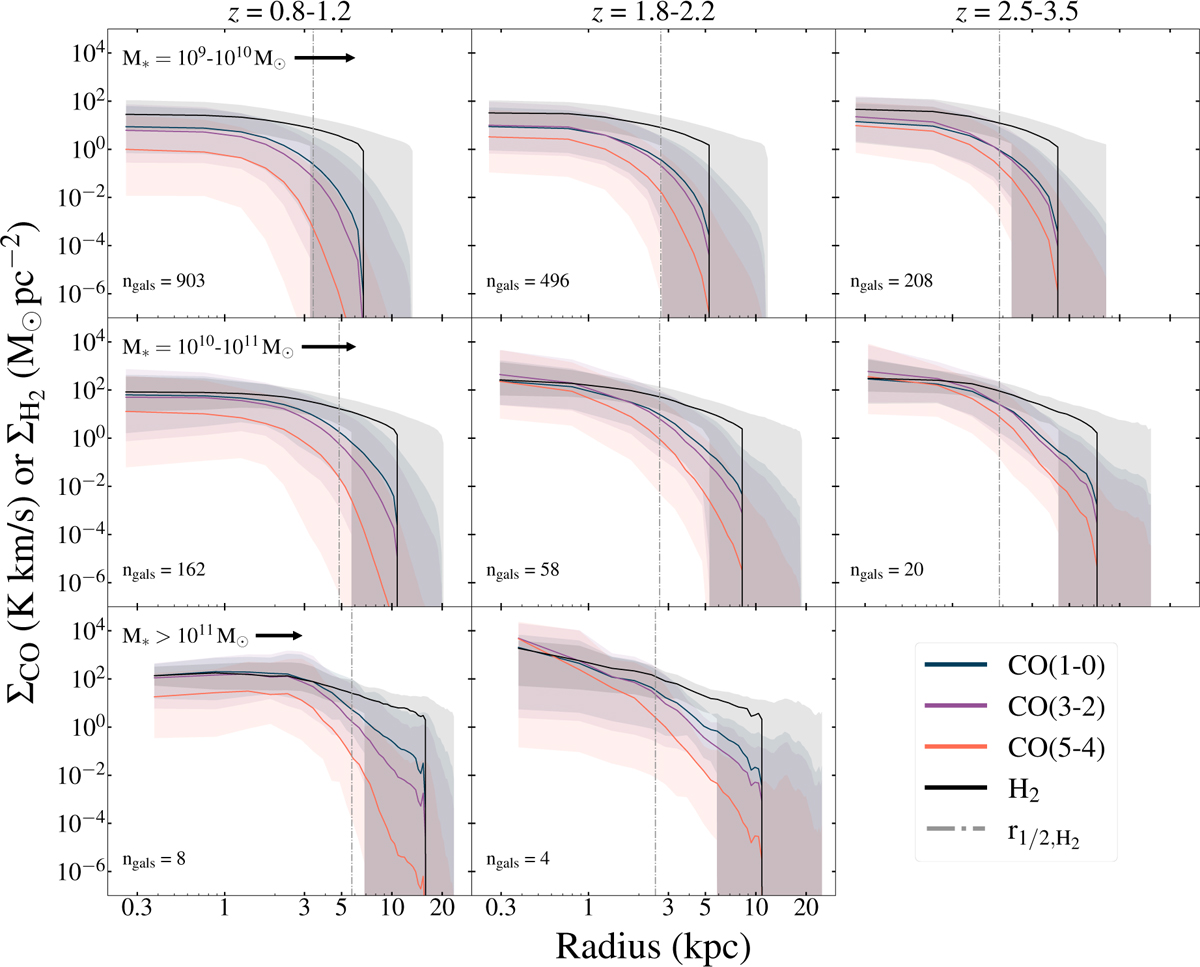
Fig. 3
Download original image
Average radial profiles of CO surface brightness and H2 surface density. The x-axis is plotted in log scale. The solid lines represent the median values per radial bin, averaged across the galaxy sample shown in each panel. The shaded regions encompass the 16th and 84th percentiles of the values per radial bin. Each column shows a different redshift slice, as labelled at the top, whereas each row is for a different stellar mass bin, as indicated in the left of each row. Given the volume of SIMBA25, the highest mass bin contains the fewest galaxies. Only three CO transitions are shown, for clarity (legend at right).
Current usage metrics show cumulative count of Article Views (full-text article views including HTML views, PDF and ePub downloads, according to the available data) and Abstracts Views on Vision4Press platform.
Data correspond to usage on the plateform after 2015. The current usage metrics is available 48-96 hours after online publication and is updated daily on week days.
Initial download of the metrics may take a while.