Open Access
Fig. 2
Download original image
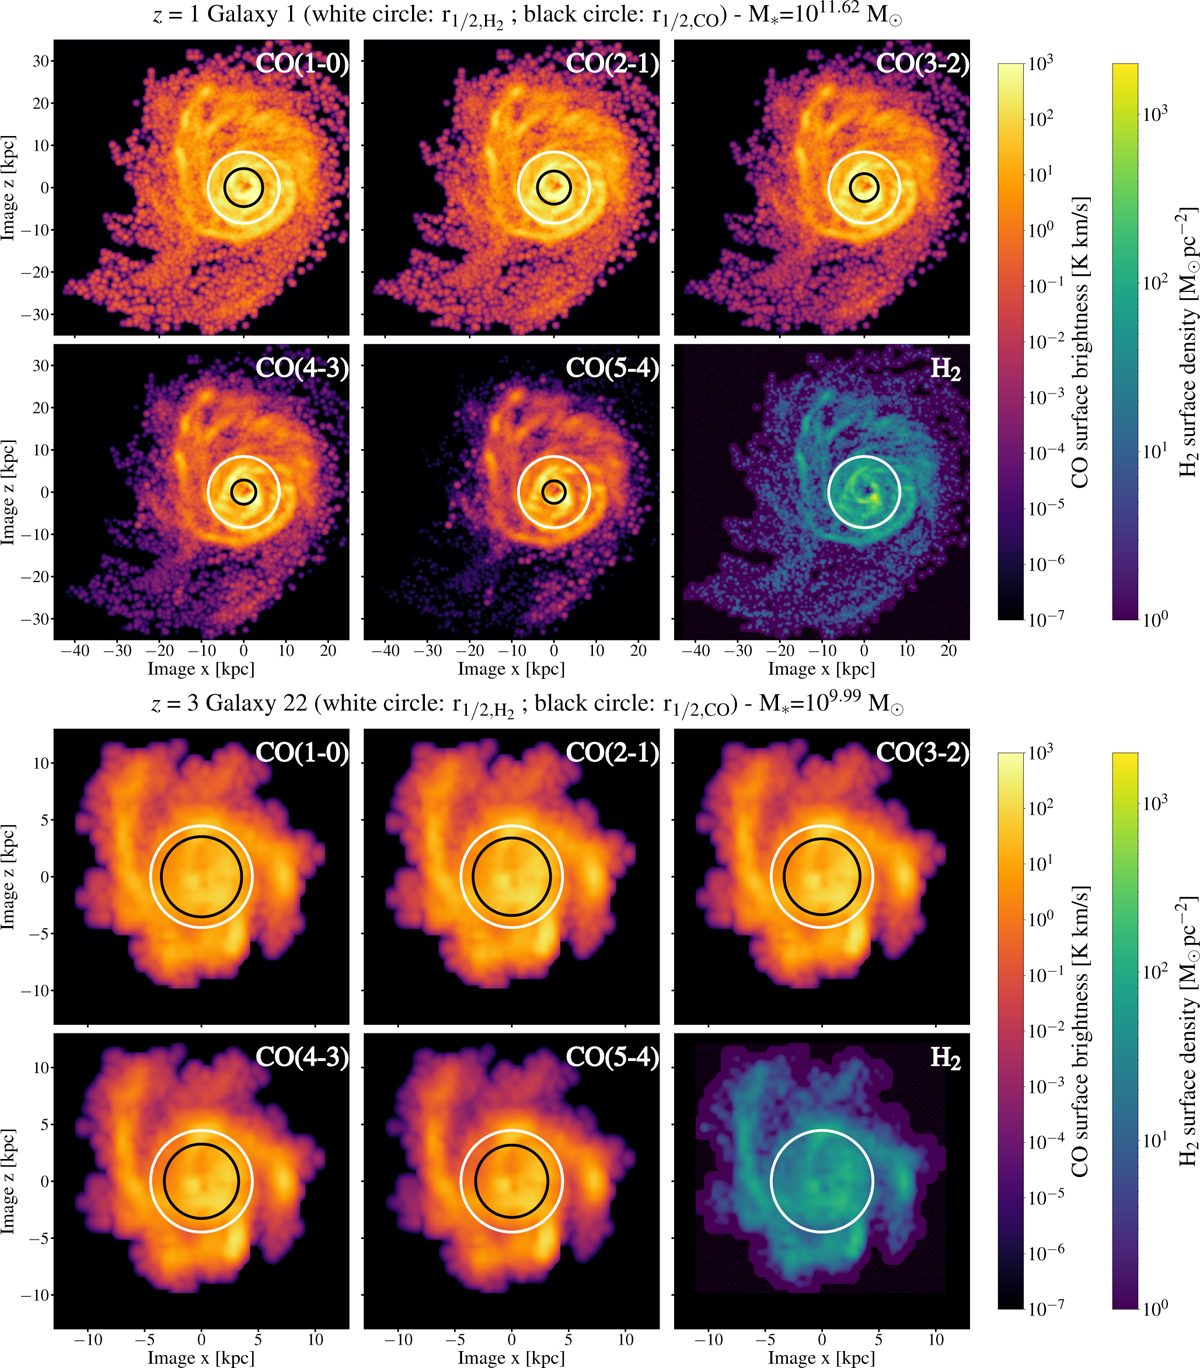
Example of the resolved CO emission and H2 surface density from two massive galaxies, at z = 1 (top) and z = 2.5 (bottom). The half-light radii of the CO transitions labelled at the top of each panel are represented by the black circles, whereas the H2 half-mass radii are represented by the white circles.
Current usage metrics show cumulative count of Article Views (full-text article views including HTML views, PDF and ePub downloads, according to the available data) and Abstracts Views on Vision4Press platform.
Data correspond to usage on the plateform after 2015. The current usage metrics is available 48-96 hours after online publication and is updated daily on week days.
Initial download of the metrics may take a while.