Open Access
Fig. A3
Download original image
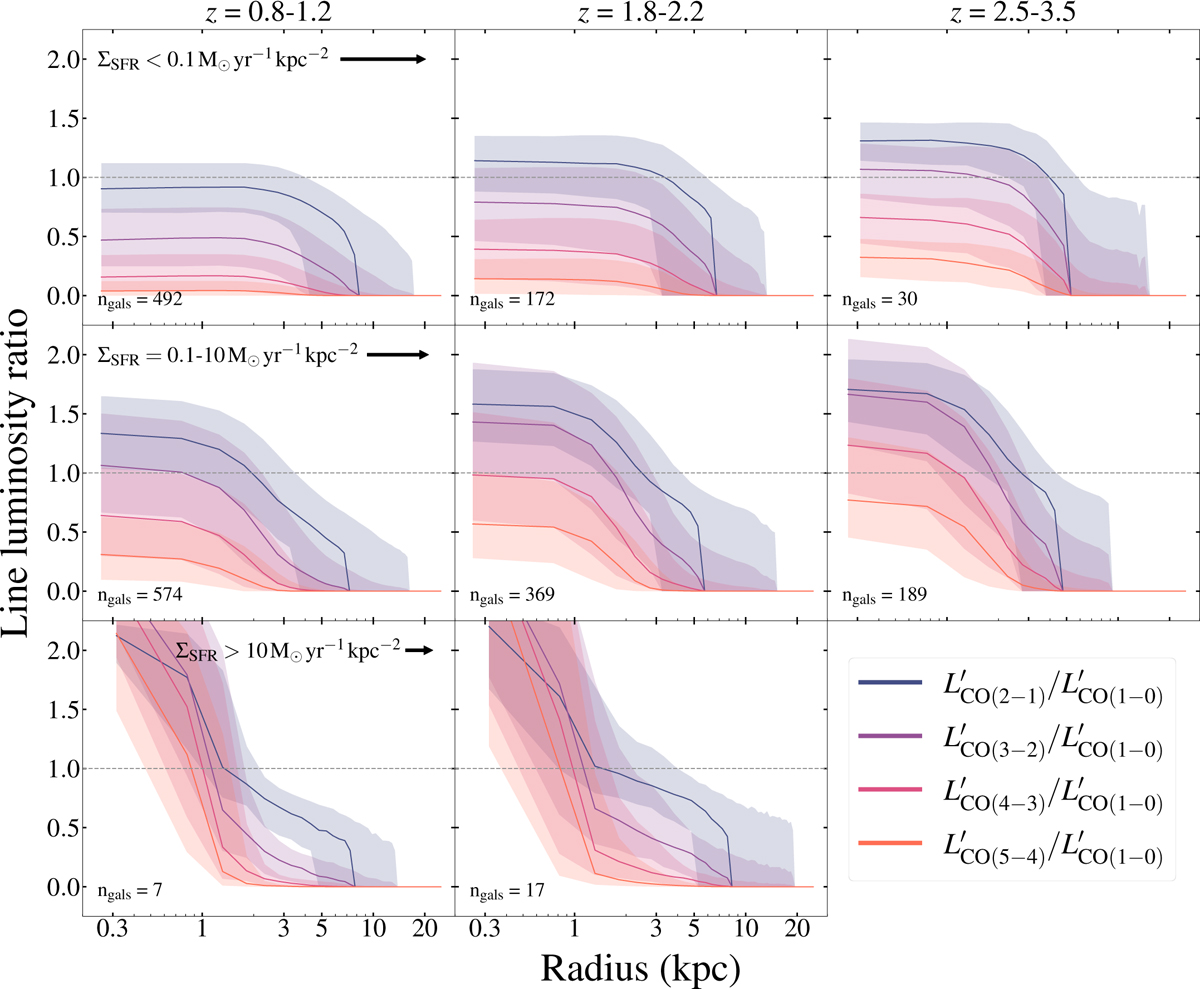
Average radial profile of the CO line luminosity ratios, in the same bins of redshift (columns) as Fig. 5, but the rows now in bins of ΣSFR. The solid lines represent the median line ratios, averaged across the entire galaxy sample shown in each panel, while the spread encompasses the 16th to 84th percentile values.
Current usage metrics show cumulative count of Article Views (full-text article views including HTML views, PDF and ePub downloads, according to the available data) and Abstracts Views on Vision4Press platform.
Data correspond to usage on the plateform after 2015. The current usage metrics is available 48-96 hours after online publication and is updated daily on week days.
Initial download of the metrics may take a while.