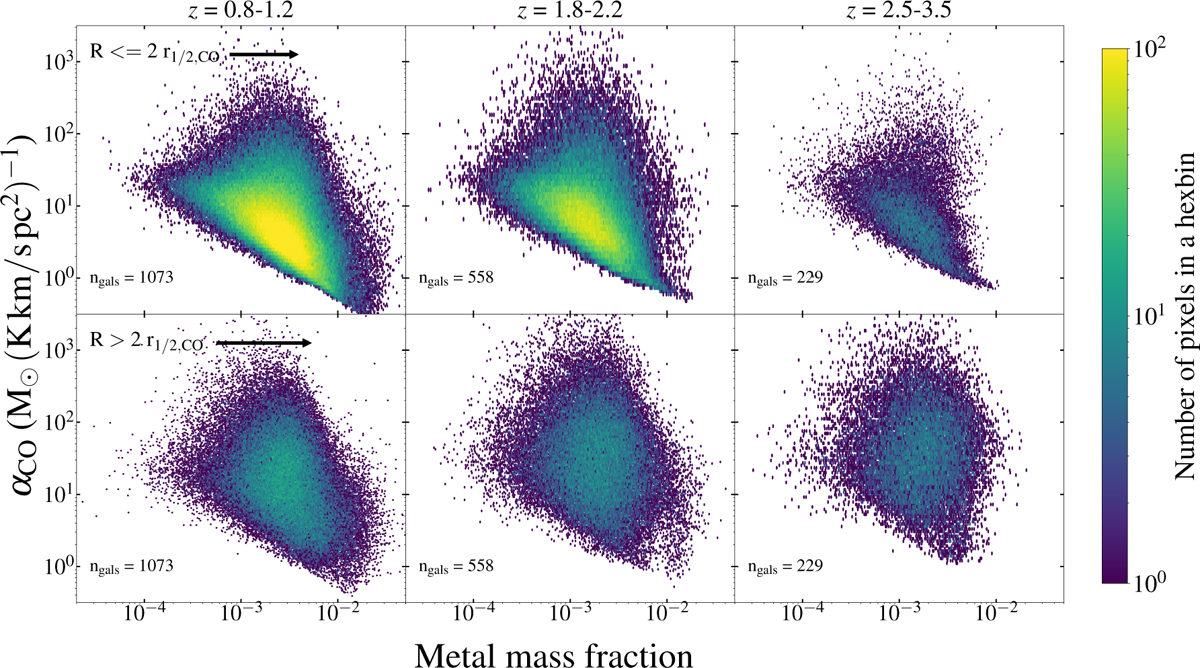
Fig. 10
Download original image
αCO vs. gas-phase metallicity per pixel, including the pixels of all synthetic CO(1–0) maps for the entire z = 1–3 sample. The color-coding represents the number of pixels per hexbin as shown via a color bar on the right of the figure. The columns again show different redshift bins, whereas the rows indicate the radial position of the clouds within the galaxies with respect to twice the CO(1–0) half-light radius of the galaxy: inner (top), outer (bottom).
Current usage metrics show cumulative count of Article Views (full-text article views including HTML views, PDF and ePub downloads, according to the available data) and Abstracts Views on Vision4Press platform.
Data correspond to usage on the plateform after 2015. The current usage metrics is available 48-96 hours after online publication and is updated daily on week days.
Initial download of the metrics may take a while.