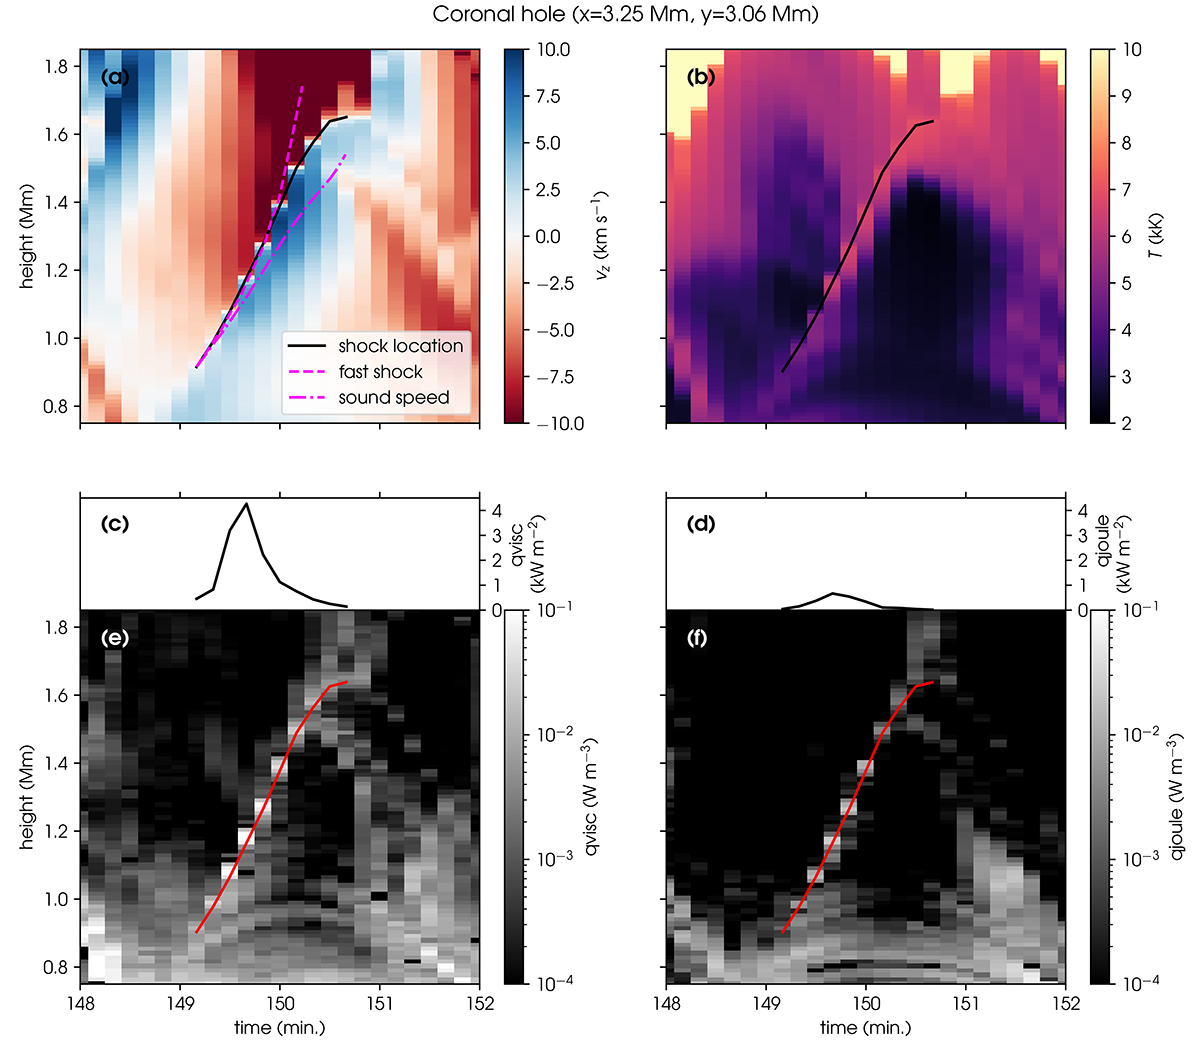
Fig. 8.
Download original image
A column of the coronal hole simulation where a wave front develops into a shock. x-axes show simulation time in minutes, and y-axes show height above the surface in Mm. Panel (a) shows vertical velocity, (b) shows temperature, and (e) and (f) show the viscous and Ohmic (or Joule) volumetric dissipation coefficients. The lines of panels (c) and (d) are the volumetric dissipation coefficients integrated over the 5 grid points constituting the computational stencil of the shock front. The solid lines in panels (a), (b), (c), and (d) show the location of the shock front. The dashed and dash-dotted magenta lines in panel (a) traces particles travelling with the local fast-mode and sound speed cs respectively.
Current usage metrics show cumulative count of Article Views (full-text article views including HTML views, PDF and ePub downloads, according to the available data) and Abstracts Views on Vision4Press platform.
Data correspond to usage on the plateform after 2015. The current usage metrics is available 48-96 hours after online publication and is updated daily on week days.
Initial download of the metrics may take a while.