Fig. 6.
Download original image
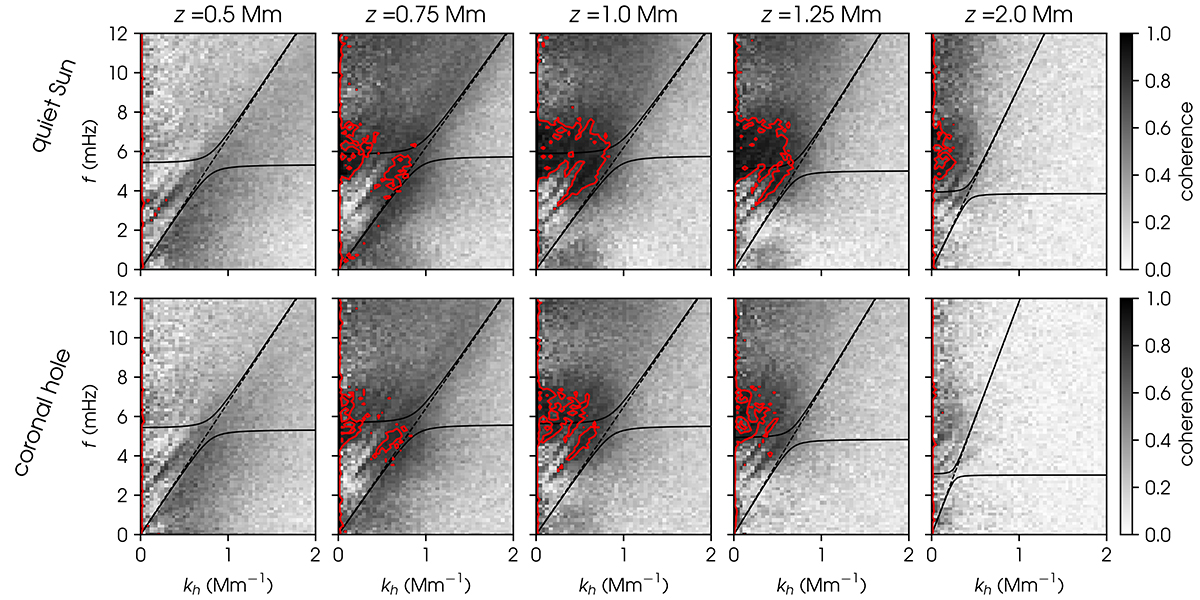
kh − ν diagram of coherence Km, q between mechanical flux ℱm and viscous dissipation ℱq. Km, q, given by Eq. (6), is calculated at five different heights in the simulated chromospheres. The solid black lines are the dispersion relations calculated from time-averaged quantities at each height. The red contour line outlines the 80% confidence interval.
Current usage metrics show cumulative count of Article Views (full-text article views including HTML views, PDF and ePub downloads, according to the available data) and Abstracts Views on Vision4Press platform.
Data correspond to usage on the plateform after 2015. The current usage metrics is available 48-96 hours after online publication and is updated daily on week days.
Initial download of the metrics may take a while.