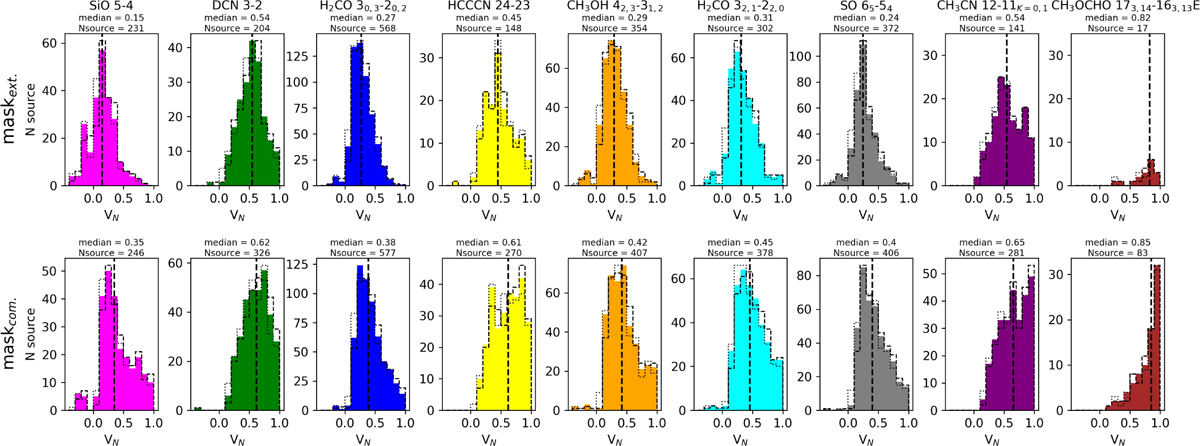
Fig. 9
Download original image
Morphological correlation between the continuum emission and the line emission (moment-0) for the indicated transition, as quantified by VN parameter from the astroHOG method. Values of VN ≈ 0 and VN ≈ 1 correspond to no correlation and perfect correlation in the distribution of the two emissions, respectively. The upper panels correspond to the correlation on the intersection of the moment-0 line emission mask and the maskext.. The lower panels correspond to a mask selecting only the compact sources where the line is detected, starting from maskcom.. The dotted and dashed histograms represent how the distribution would change if all the values were replaced by VN − error (the error on the value of VN is derived using an MC method, see Sect. 4.3) and VN+ error, respectively.
Current usage metrics show cumulative count of Article Views (full-text article views including HTML views, PDF and ePub downloads, according to the available data) and Abstracts Views on Vision4Press platform.
Data correspond to usage on the plateform after 2015. The current usage metrics is available 48-96 hours after online publication and is updated daily on week days.
Initial download of the metrics may take a while.