Fig. 4
Download original image
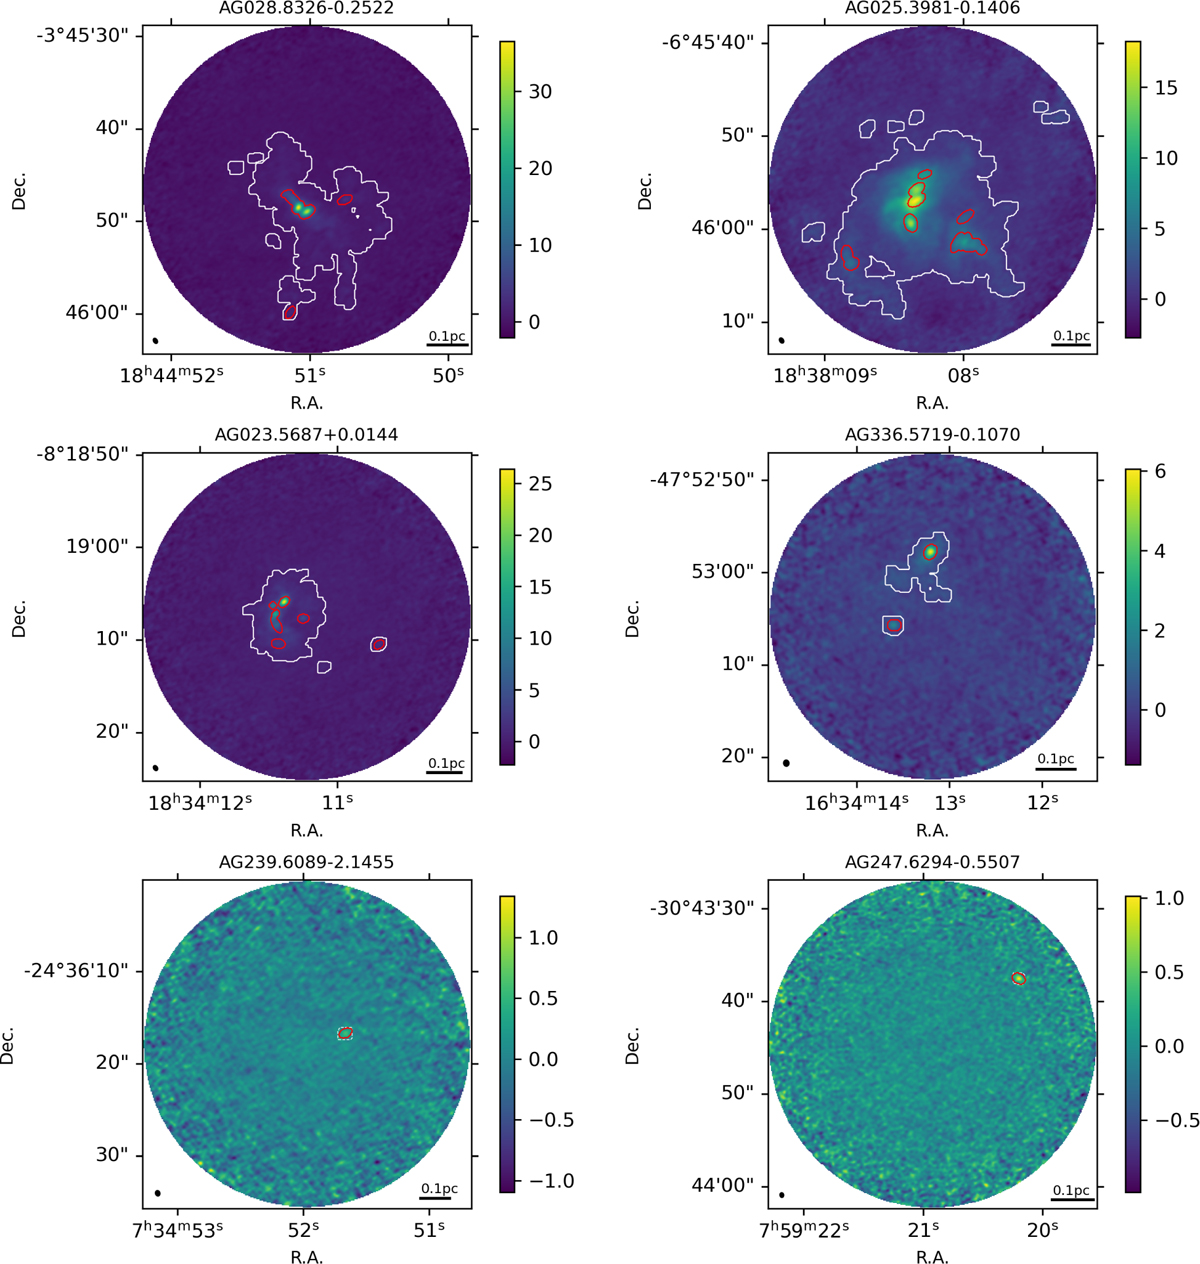
Examples of continuum emission for six sources in the ALMAGAL sample. Upper row: continuum maps of two example sources with large diffuse emission outside the cores. Middle row: continuum maps of two example sources for which the diffuse emission is present but more restricted in area. Lower row: continuum maps of two example sources in which the continuum emission is well described by the mask of all compact sources only (the maskext, is plotted in dashed white for reference). Red contour: maskcomp., white contour: maskext. (see Section 4.4). The continuum image color scales are in Jy/beam.
Current usage metrics show cumulative count of Article Views (full-text article views including HTML views, PDF and ePub downloads, according to the available data) and Abstracts Views on Vision4Press platform.
Data correspond to usage on the plateform after 2015. The current usage metrics is available 48-96 hours after online publication and is updated daily on week days.
Initial download of the metrics may take a while.