Fig. 2
Download original image
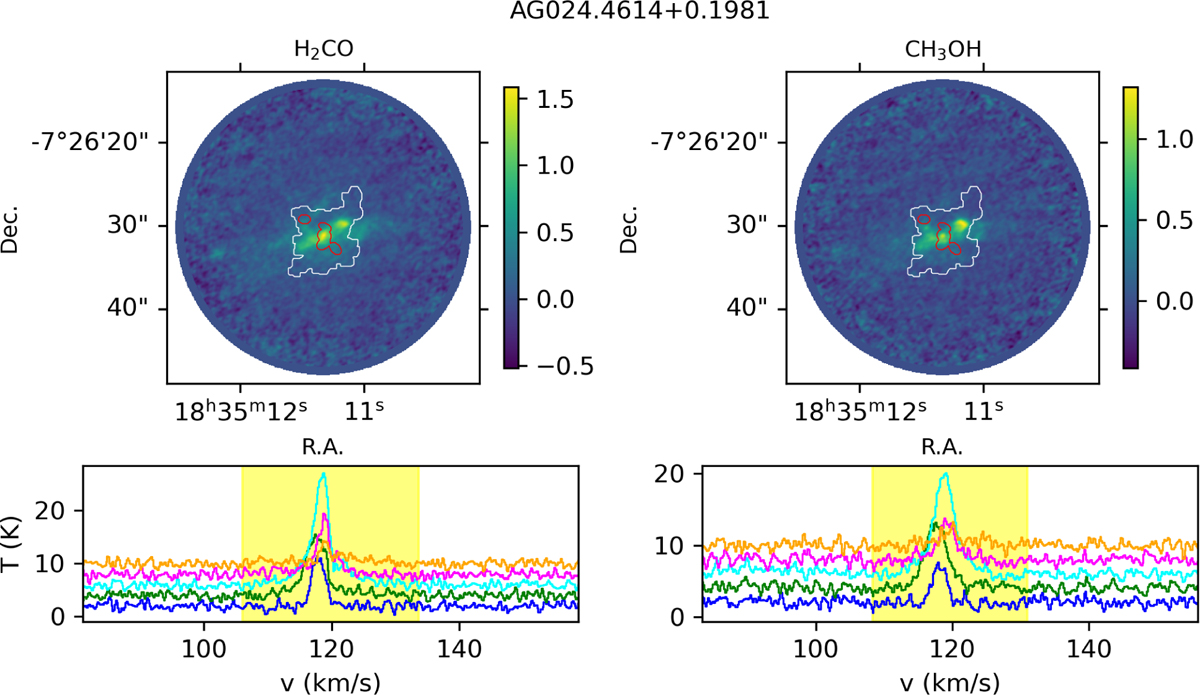
Moment-0 maps and spectral range created with the automated routine described in Sect. 4.1. Upper row: moment-0 map of H2CO 30,3−20,2 (left) and CH3OH 22,3−31,2 (right) for source AG024.4614+0.1981. The color scales are in units of Jy/beam km/s. Lower row: spectra averaged over the 12 continuum cores detected in the source (ellipse with semiaxis the HWHM = 1.177σ from the 2D Gaussian fit). Each core spectrum has an y-axis offset to show the spectra better. The yellow area indicates the range for the velocity integration we used to obtain the moment-0 maps shown in the upper panel. The red contours are the contours of maskcom., and the white contour is the contour of maskext., defined from the continuum emission (see Section 4.4 for details). For this source, the continuum emission is shown in Fig. 4.
Current usage metrics show cumulative count of Article Views (full-text article views including HTML views, PDF and ePub downloads, according to the available data) and Abstracts Views on Vision4Press platform.
Data correspond to usage on the plateform after 2015. The current usage metrics is available 48-96 hours after online publication and is updated daily on week days.
Initial download of the metrics may take a while.