Fig. B.1
Download original image
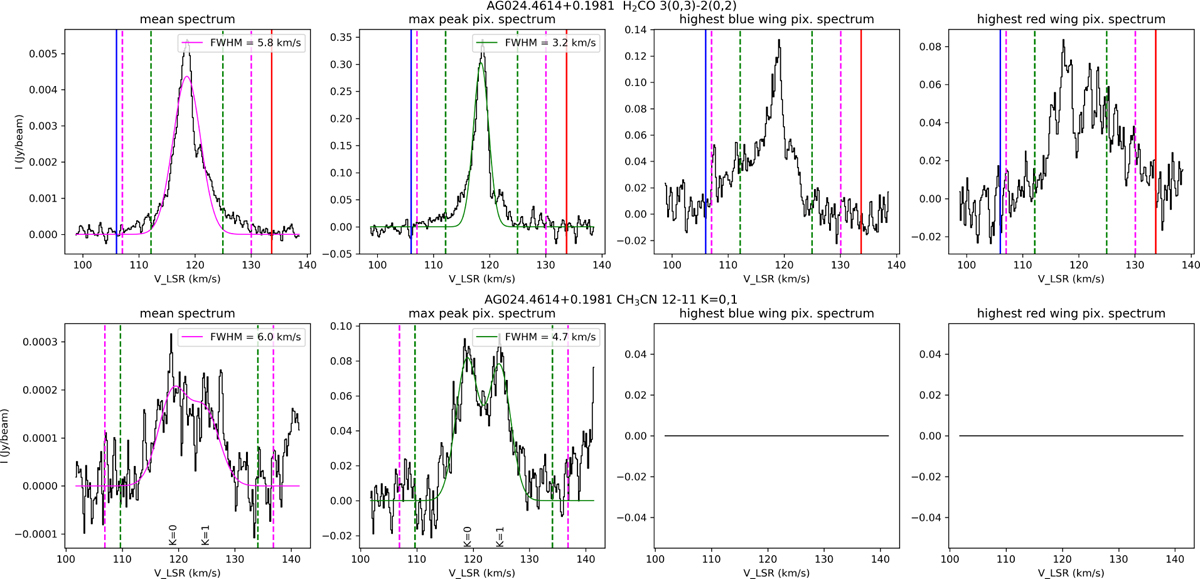
Steps of the determination of the range of integration for the moment-0 maps for the example source AG024.4616+0.1981 for H2CO 3(0,3)-2(0,2) (top row) and CH3CN 120,1 − 110,1 (bottom row). Top row from left: 1) mean spectrum over all the pixel with peak emission above 4 S/N, with its best fit and derived range of integration in magenta; 2) pixel with highest peak spectrum, with its best fit and derived range of integration in green; 3) spectrum of the pixel with the blue-wing terminating at the lowest velocity, marked by the blue vertical line; 4) spectrum of the pixel with the red-wing terminating at the highest velocity, marked by the red vertical line. Bottom row: same as top row, but for CH3CN 120,1 − 110,1 for which a 2-Gaussian fit is performed to include both K=0 and K=1 line. No spectra are shown in the last two panel since no pixel was found with wings above the integration range defined by the first two panels.
Current usage metrics show cumulative count of Article Views (full-text article views including HTML views, PDF and ePub downloads, according to the available data) and Abstracts Views on Vision4Press platform.
Data correspond to usage on the plateform after 2015. The current usage metrics is available 48-96 hours after online publication and is updated daily on week days.
Initial download of the metrics may take a while.