Fig. 11
Download original image
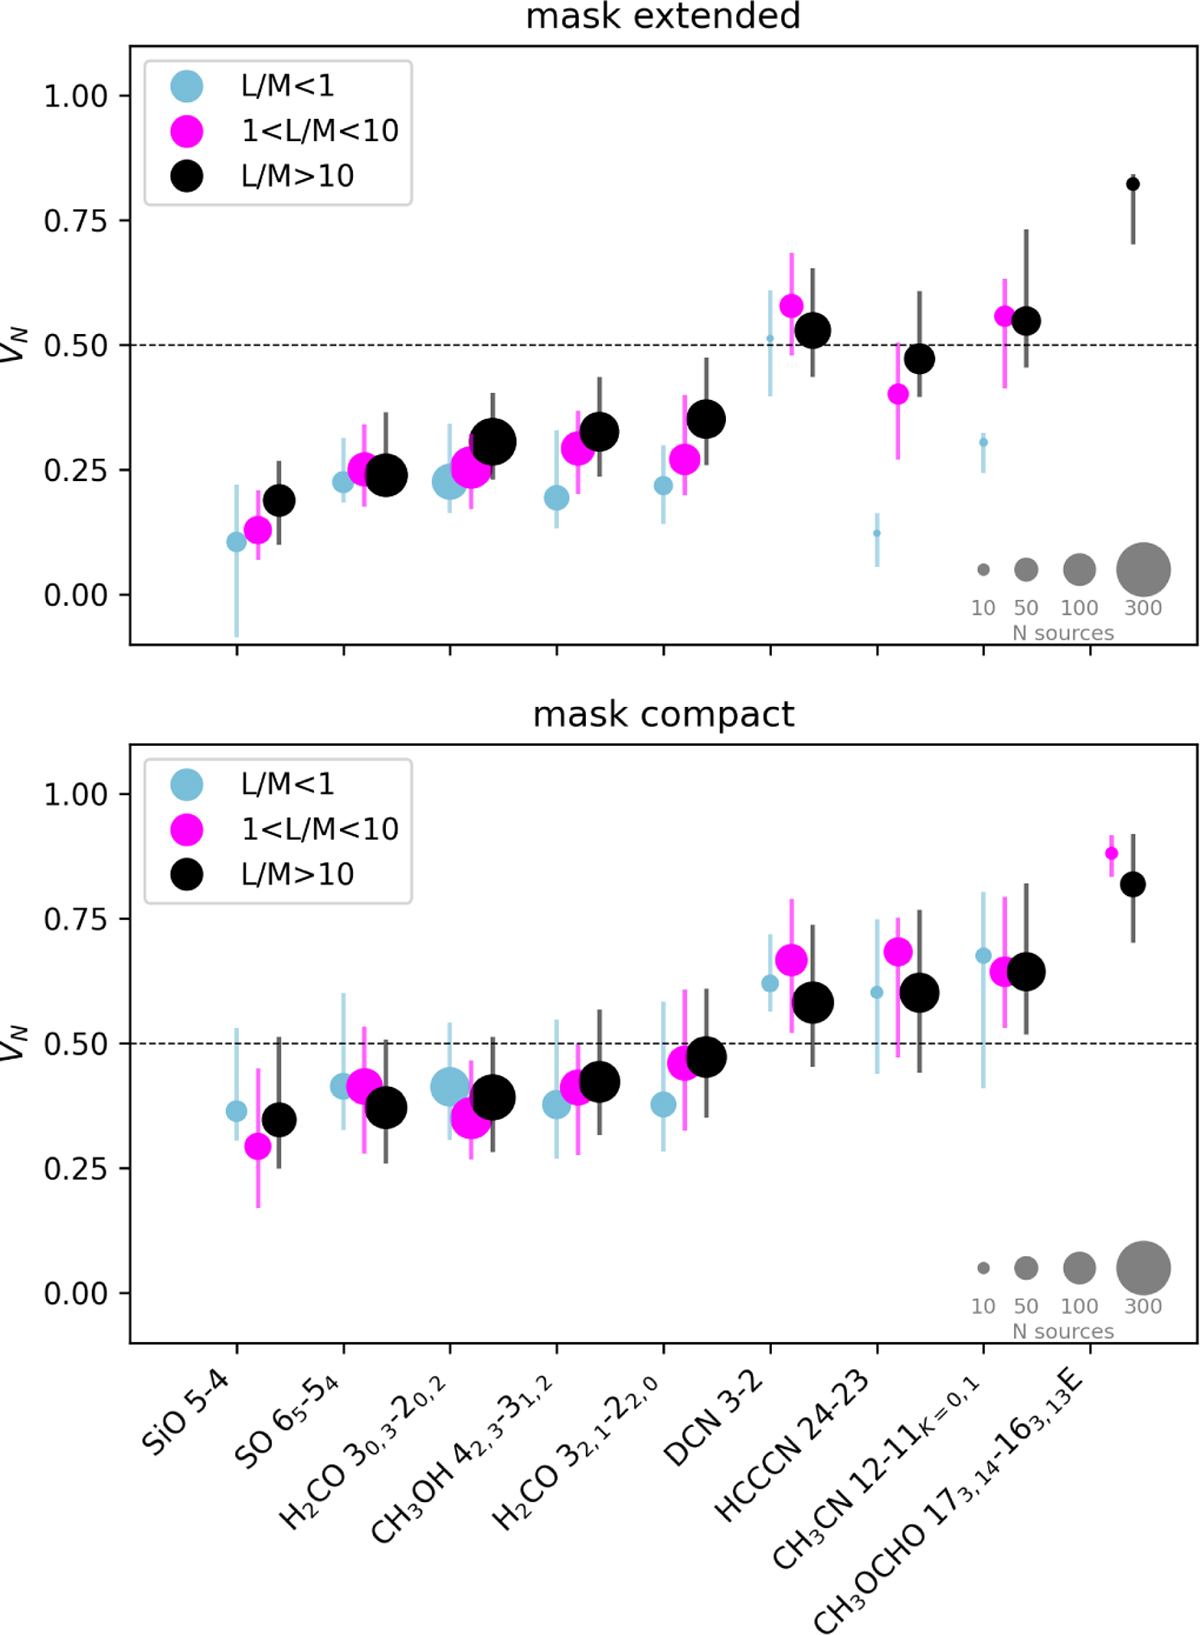
Upper panel: median value of VN histograms for the maskext. dividing the sample into three evolutionary stages; lower panel: median value of VN histograms for the maskcom. dividing the sample into three evolutionary stages. The horizontal dashed line represent the values of VN for which ~50% of the area has a good agreement in the two maps (continuum and moment-0).
Current usage metrics show cumulative count of Article Views (full-text article views including HTML views, PDF and ePub downloads, according to the available data) and Abstracts Views on Vision4Press platform.
Data correspond to usage on the plateform after 2015. The current usage metrics is available 48-96 hours after online publication and is updated daily on week days.
Initial download of the metrics may take a while.