| Issue |
A&A
Volume 699, July 2025
|
|
|---|---|---|
| Article Number | A77 | |
| Number of page(s) | 9 | |
| Section | Stellar structure and evolution | |
| DOI | https://doi.org/10.1051/0004-6361/202452624 | |
| Published online | 30 June 2025 | |
Significant reflection and absorption effects in the X-ray emission of the intermediate polar IGR J17195-4100
1
Departament de Física, EEBE, Universitat Politècnica de Catalunya, c/Eduard Maristany 16, 08019 Barcelona, Spain
2
Department of Astronomy and Space Sciences Faculty of Science, Istanbul University Beyazit, 34119 Istanbul, Türkiye
3
Faculty of Engineering and Natural Sciences, Kadir Has University, Cibali, Istanbul 34083, Türkiye
4
Institut d’Estudis Espacials de Catalunya (IEEC), 08860 Castelldefels, Barcelona, Spain
⋆ Corresponding author.
Received:
15
October
2024
Accepted:
7
May
2025
Abstract
Context. X-ray emission is emitted from shock-heated plasma in magnetic cataclysmic variables, particularly in intermediate polars, and is processed by absorption and scattering before reaching the observer.
Aims. We investigate these effects in the X-ray emission of the intermediate polar IGR J17195-4100 by carrying out the X-ray spectral analysis, and examining spin modulation and hardness ratio.
Methods. We present high-sensitivity broadband X-ray spectral analysis by combining NuSTAR and XMM-Newton observations in the 0.3–78.0 keV energy range. X-ray spectral analysis is performed using six composite models, including the angle-dependent reflection model (reflect), multi-temperature plasma emission models (CEVMKL, MKCFLOW), and photoionised and/or neutral partially covering absorption models (zxipcf, pcfabs) within XSPEC. We also examine the spin modulation in four energy ranges and the hardness ratio to determine the absorption and scattering effects.
Results. We find that the spectrum is best modelled with a reflection amplitude (Ω) of 0.58 −0.26+0.38, an ionisation parameter, log(ξ), of 1.46−0.23+0.44 with an equivalent hydrogen column density of 3.09−0.68+2.26 × 1022 cm−2, a neutral absorber, and a multi-temperature plasma temperature of 27.14−2.13+2.0 keV. In addition, we detect effects of electron scattering in the NuSTAR band, leading to a modulation amplitude of approximately a steady 9%, which rises to 15% after 20 keV.
Conclusions. We stress that these effects significantly affect the X-ray emission of intermediate polars and should be considered to obtain a good representation of the intrinsic spectrum.
Key words: accretion / accretion disks / magnetic fields / scattering / novae / cataclysmic variables
© The Authors 2025
 Open Access article, published by EDP Sciences, under the terms of the Creative Commons Attribution License (https://creativecommons.org/licenses/by/4.0), which permits unrestricted use, distribution, and reproduction in any medium, provided the original work is properly cited.
This article is published in open access under the Subscribe to Open model. This email address is being protected from spambots. You need JavaScript enabled to view it. to support open access publication.
1. Introduction
Magnetic cataclysmic variables (MCVs) are binary systems in which a late-type main sequence star accretes onto a magnetised white dwarf (WD) (Warner 1995). Intermediate polars (IPs), which are a subclass of MCVs, have a magnetic field strength in the range 105–107 Gauss, allowing for an accretion disk around the WD. The matter on the accretion disk is channelled to the magnetic field lines of the WD near the Alfven radius and falls freely through the gravitational potential towards the poles of the WD (Patterson 1994).
Close to the surface of the WD, the infalling gas accelerates to high supersonic speeds, and then a strong steady shock forms above the poles of the WD, as it must decelerate. In the shock, the kinetic energy of the infalling matter turns into thermal energy, resulting in the hot plasma that emits strong X-rays via optically thin thermal emission in the post-shock (Ezuka & Ishida 1999). The shocked plasma has a temperature distribution that ranges from a maximum temperature at the shock, gradually cooling through thermal bremsstrahlung until it settles on the WD surface (Fabian et al. 1976). The observed X-ray spectrum shows features such as ∼1 keV lines from the iron L shell and the presence of H- and He-like iron Kα emission lines at 6.9 keV and 6.7 keV, respectively, indicating the nature of optically thin thermal plasma emission (Done & Magdziarz 1998; Mukai 2017; Hōshi 1973).
Assuming the X-ray source emits isotropically as expected, some fraction of the X-rays can be reflected by the WD surface and also reprocessed by relatively cold regions such as the pre-shock region and the WD surface (Done et al. 1995; Lightman & White 1988). Thus, the X-ray spectrum of IPs can be described not only by the nature of the multi-temperature plasma but also by the inclusion of scattering and absorption properties.
The X-rays can impinge on the relatively cold WD surface and then be reflected by cold electrons, through processes including Compton scattering. Reflection from a relatively cold, optically thick surface, such as the WD surface, causes the Fe Kα fluorescent line emission at 6.4 keV and the Compton reflection hump, which hardens the spectrum in the energy range 10–30 keV (George & Fabian 1991; van Teeseling et al. 1996; Beardmore et al. 1995; Magdziarz & Zdziarski 1995; Done & Magdziarz 1998; Ezuka & Ishida 1999). These effects of reflection in the X-ray spectrum have previously been studied in MCVs (Rothschild et al. 1981; Beardmore et al. 1995, 2000; van Teeseling et al. 1996; Cropper et al. 1998; Revnivtsev et al. 2004; Mukai et al. 2015; Dutta & Rana 2022; Hayashi et al. 2011, 2021; Joshi et al. 2023). Given that reflection modifies the intrinsic spectrum, it is important to consider the reflection component, especially in X-ray spectral analyses, to estimate the physical quantities of IP systems, such as the WD mass, the radius, and height of the shock (Hayashi et al. 2011). Previous research has shown that the reflected spectrum is angle dependent becoming harder as the viewing angle, cos i, increases (angle i measured with respect to the normal of the reflecting surface) (Hua & Lingenfelter 1992; Magdziarz & Zdziarski 1995). However, it is not only the shape of the reflected spectrum that depends on the viewing angle; many factors also influence the reflection effect. A small shock height increases the reflection effect as it enhances the solid angle of the WD surface with respect to the accretion column, but for the same geometry the equivalent width of the Fe Kα fluorescence line is decreased (Luna et al. 2018; Hayashi et al. 2018; Beardmore et al. 2000). Similarly, a massive WD, and therefore a larger specific accretion rate, increases the reflection effect because this results in a hotter and shorter shock height (cf. Fig. 22 Hayashi et al. 2018). Additionally, the equivalent width of the Fe Kα fluorescent line is angle dependent and decreases with increasing i (George & Fabian 1991; Hayashi et al. 2018), whereas it increases with increasing iron abundance (Hayashi et al. 2018).
IPs are known to show complex absorber features in soft X-rays. The X-ray emission region is covered by absorbing material, and some fraction of the X-ray photons have to travel through this region before they reach the observer (Done et al. 1995; Balman 2012). This intrinsic absorption originates from relatively cool regions of the system, such as the surface of the WD, the accretion column, the accretion curtain, and the accretion disk, etc. The absorber material cannot be characterised only by neutral matter, because the hard X-rays can partially ionise the absorber material (Cropper et al. 1998; Dutta & Rana 2022; Islam & Mukai 2021; Pekön & Balman 2012). Thus, especially below 4.0 keV, the neutral and/or ionised absorption features can be seen in soft X-rays. Similarly to Compton reflection, absorption causes spectral hardening, but in relatively softer X-ray spectra (Done & Magdziarz 1998).
The absorption, occultation, and scattering can lead to modulations of the X-ray light curve due to the spin or orbital period. The X-ray spin and orbital modulations have been investigated in many MCVs and IP systems by Hellier (1993), Parker et al. (2005), Norton & Watson (1989), Norton et al. (1997), Kim & Beuermann (1995), Evans & Hellier (2004), and Balman et al. (2024). The accretion flow above the shock causes attenuation of the X-ray emission through absorption and electron scattering. Additionally, the WD surface can occult the X-ray source, reducing the X-ray emission. In each case, the X-ray emission decreases periodically due to WD spin, causing modulation of the spin-folded X-ray light curves. In soft X-rays, photoelectric absorption dominates spin modulation due to its energy dependence, and is expected to decrease with increasing energy. However, spin modulation also depends on the geometry and presence of other absorption mechanisms within the system (Norton & Watson 1989; Kim & Beuermann 1995).
IGR J17195-4100 was discovered by Bird et al. (2004) in the INTEGRAL Galactic Plane survey conducted in February and October 2003. Barlow et al. (2006) then carried out hard X-ray spectral analysis in the 20–100 keV energy range using INTEGRAL/IBIS data and obtained a temperature of 27.0 ± 4.4 keV with an X-ray flux of 2.46 × 10⁻¹¹ erg s−1 cm−2 as the best-fit result. Through investigation of the optical spectrum obtained from observations of the CTIO telescope, Masetti et al. (2006) identified the source as an MCV. Later, Butters et al. (2008) classified IGR J17195-4100 as an intermediate polar and determined its orbital period to be approximately 1.7 hours using the RXTE observation. Pretorius (2009) further calculated the orbital period of 4.005 ± 0.006 h and spin period of 1139.55 ± 0.03 s with optical time-resolved observations. Bernardini et al. (2012) also measured the spin period of 1062 ± 2 s using the X-ray Multi-Mirror Mission (XMM-Newton) observations. Then, Girish & Singh (2012) calculated the new period of the IGR J17195-4100 using XMM-Newton and Suzaku observations with a spin period of 1053.7 ± 12.2 s and an orbital period of 3.52 h. Several studies have estimated the mass of IGR J17195-4100. Yuasa et al. (2010) estimated 1.03
 M⊙ with a temperature of 59.6 keV, using Suzaku in the 3.0–50 keV energy range, Suleimanov et al. (2019) find 0.72 ± 0.06 M⊙ using the Nuclear Spectroscopic Telescope Array (NuSTAR) and Swift/BAT data above 20 keV, and lastly Shaw et al. (2020) obtain 0.84
 M⊙ along with a temperature of 22.9
 keV using NuSTAR observations in the 20–78 keV energy range.
In this study, we investigated the broadband spectral analysis of IGR J17195-4100 using the XMM-Newton and NuSTAR observations in the range of 0.3–78.0 keV with six composite models, examining the presence of reflection and ionised and/or neutral absorption effects with different multi-temperature plasma models. Unlike previous studies, in the present work, NuSTAR data were used, including the whole 3.5–78.0 keV energy range. This was also the first time that the ionised absorption and angle-dependent reflection effects were considered for this source, and investigated in the 0.3–78 keV range for IGR J17195-4100. In addition, we present spin modulation analysis in four different NuSTAR energy ranges to detect modulations due to possible absorption and electron scattering effects.
2. Observation and data reduction
In this study, we used publicly available archival X-ray data from the NuSTAR and XMM-Newton observatories. IGR J17195-4100 was observed by NuSTAR (OBSID = 30460005002) for a duration of 29.5 ks on October 25, 2018 and by XMM-Newton (OBSID = 0601270201) for a duration of 33.9 ks on September 3, 2009, as published in Bernardini et al. (2012).
NuSTAR launched by NASA in 2012, was the first X-ray telescope in orbit to image in the 3–79 keV band. It is designed with two similar Wolter I-type X-ray optics (OMA and OMB) focussed on two similar focal plane modules (FPMA and FPMB) (Harrison et al. 2013; Madsen et al. 2015). We reprocessed the NuSTAR data using NuSTAR data analysis software (NuSTARDAS v2.1.2), part of High Energy Astrophysics Software (HEASOFT) v6.30, with standardised filtering criteria and calibration database (CALDB) (20220331) files to obtain high-quality science data. The main NuSTARDAS script, nupipeline, was used to generate calibrated and cleaned science-quality event files. We then selected the source and background circular regions using DS9 and extracted the 70″ and 100″ regions, respectively, from the clean event files (the sizes of the background regions were normalised to the source regions). Finally, we used the nuproduct task to generate the light curves, sky images, and energy spectra using the source and background regions, and grouped all spectra with at least 40 counts per bin using the grppha FTOOLS command.
XMM-Newton was launched in 1999 by the European Space Agency (ESA), observing the X-ray, ultraviolet, and optical sky with the six coaligned instruments, including three X-ray European Photon Imaging Camera (EPIC) (PN, MOS1, and MOS2) and two X-ray RGSs (reflection grating spectrometers) and the OM (optical monitor) (Jansen et al. 2001; Lumb et al. 2012). The XMM-Newton energy range of 0.1–10 keV is an important contribution to spectral analysis in soft X-rays. We used the EPIC pn data due to its high sensitivity and high time resolution. These data were reduced and calibrated by SAS (scientific analysis system) software (v19.1.0) with the latest calibration files using the epicproc task.
We then checked a light curve in the range 10 keV–12 keV from the event file to detect possible solar flares. Following this inspection, we created good time intervals to filter out the detected solar flares from the data. Since the source is bright, we checked the generated event file for pile-up with the epatplot task. In order to remove the identified pile-up effect, we excluded the circular source region of size 6″ from the bright central point. Consequently, the source photons were extracted from an annular region of inner radius 6″ and outer radius 40″ from the source position, and the background photons were extracted from a circular region of 40″. Even after the pile-up removal, we restricted our analysis of EPIC pn data to energies lower than 8 keV to avoid the slight residual spectral hardening observed in the epatplot results after pile-up mitigation.
Finally, we used the task evselect to generate the source and background spectra using defined regions from the filtered event file and including photons with a quality flag equal to zero and a pattern less than or equal to four. The redistribution matrix and ancillary file were created using the SAS tasks, RMFGEN and ARFGEN, respectively. The spectra were grouped with the grppha task, using a minimum of 150 counts per bin.
For further joint spectral analyses using two different missions, HEASOFT v6.301 and XSPEC v12.142 were used.
In order to perform spin modulation analysis, we chose only FPMA and FPMB data of NuSTAR, as Bernardini et al. (2012) had previously studied the spin modulation of IGR J17195-4100 using XMM-Newton. The background-subtracted light curves of NuSTAR data are generated using nuproduct task of NuSTARDAS. Utilising the pilow and pihigh parameters of the nuproduct task, we produced these light curves in different energy ranges using the channel-energy conversion equation3 for NuSTAR. The spin period of IGR J17195-4100 is found to be 1057.3 s by Girish & Singh (2012) using the XMM-Newton and Suzaku missions. We employed the XRONOS software package tool efold to fold light curves at the spin period of 1057.3 s, and produced spin pulsed-profile and hardness ratios.
3. Analysis
3.1. Spectral analysis
The X-ray spectral analysis was performed in the 0.3–78 keV range using X-ray spectral analysis software package XSPEC v12.12.1 (Arnaud 1996). The combined spectra consisted of XMM-Newton EPIC pn data in the range of 0.3–8.0 keV and NuSTAR data in the range of 3.5–78.0 keV. Pile-up was mitigated as described in Sect. 2. The X-ray flux in the common energy range of 3.5–10.0 keV for the two instruments is obtained as 2.6 × 10⁻¹¹ erg s−1 cm−2 for EPIC pn, and 2.9 × 10⁻¹¹ erg s−1 cm−2 and 2.8 × 10⁻¹¹ erg s−1 cm−2 for FPMA and FPMB, respectively.
As emphasised earlier, the X-ray emission from MCVs is modified by the reflection effect from the WD surface, which can cause a Compton hump in the range 10–30 keV, and a fluorescent Fe Kα emission line at 6.4 keV, together with intrinsic absorption. For the analysis, we constructed six composite models, including two different plasma emission models, which are listed in Table 1. The spectral parameters resulting from the fits using these six composite models are detailed in Table 2. In addition, two of the fitted composite models are displayed in Figure 1.
Description of six composite models
Best-fit spectral parameters of the source IGR J17195-4100 with errors at 90% confidence level.
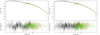 |
Fig. 1. Fitted X-ray spectrum of IGR J17195-4100 obtained from XMM-Newton (black), NuSTAR/FPMA(red), and NuSTAR/FPMB (green). Left: Fit with the composite model M3. Right: Fit with the composite model M4 (right). The second panel shows the residuals in standard deviations. |
A cross-normalisation constant (model) was included in all composite models to properly combine the three instruments in order to adjust their calibration discrepancies. This parameter was used by fixing FPMA to 1, leaving the others free. In addition, the photoelectric absorption due to the interstellar medium was fitted using the phabs model. We also tested the tbabs model but did not proceed with it, as it failed to improve the fit beyond the phabs model. The column density, NH, was iterated in the fitting process, starting from the value of 0.6 × 1022 cm−2 calculated from the HI4PI database (HI4PI Collaboration 2016).
Since X-ray photons encounter an absorbing medium before reaching the observer, X-ray spectra include absorption effects. To characterise the continuum adequately, we paid attention to the components of the absorbing media. Therefore, we created three different scenarios to obtain an adequate description of the soft X-rays. The scenarios were constructed considering absorbing material consisting of i) only a neutral absorber (models M1 and M3), ii) neutral and ionised absorbers (models M2 and M4), and iii) two ionised absorbers with two different ionisation parameters (models M5 and M6). The neutral absorber is theoretically part of the accretion column (Mukai 2017). However, the regions more likely to be close to the standing shock can also be ionised by high-energy photons. We therefore constructed the (ii) and (iii) scenarios. In (ii) there was one ionised absorber, in (iii) there were two ionised absorbers, one close to the emitting region, perhaps in the accretion curtain, and the other is further out in the disk, likely close to the stream-disk impact zone. We applied the models assuming that the X-ray emission region was partially covered by absorbing regions.
The photoelectric absorption effect was modelled with the pcfabs model, which assumes partial covering absorption by neutral material in the line of sight. There were two free parameters of the model, the column density of the absorber, NH, and the covering fraction, cvf. The absorption from the partially ionised gas was modelled by partial covering of a partially ionised absorber, the zxipcf model (Reeves et al. 2008). This model consists of four parameters: the equivalent column density of the partially ionised absorber, NH, the logarithm of the ionisation parameter, log ξ, the covering fraction, cvf, and one fixed parameter, redshift, which is fixed to zero. The ionisation parameter, ξ, is defined as ξ = LX/nr2, where LX is the X-ray luminosity, n is the number density in the absorbing gas, and r is the distance between the X-ray source and the absorbing material. As seen in Table 1, models M1 and M3 include only pcfabs, M2 and M4 include pcfabs×zxipcf, and models M5 and M6 include zxipcf×zxipcf.
Figure 2 shows the plots of three composite-fitted models (only) applied to the spectra as detailed in Table 2. It is clear that there are absorption differences in the models. The red line shows the fitted model with pcfabs (only neutral absorption), the green line shows the one with the pcfabs×zxipcf absorption component (one neutral and one ionised absorber), and the blue line represents the fitted model with zxipcf×zxipcf (two ionised absorbers). The ionised absorption model in particular plays an important role, the green line showing several absorption lines in addition to the model shown by the red line, and the blue line indicating similarly deeper lines. Moreover, as is evident from Figure 2, significant spectral continuum modification is seen between the red line and the blue or green lines in the energy range 0.4–5.0 keV. Our fits do not differentiate between the two ionised absorber-included models, due to the moderate spectral resolution. The model pcfabs modifies the continuum via neutral absorption to a given level as seen in the red line in Figure 2, but the models with ionised absorbers make the fits significantly better, showing more modification via absorption lines and continuum absorption.
The Compton scattering effect, our other main research in this study, has signatures in the X-ray spectrum with a hardening in the energy range 10–30 keV and a prominent emission at 6.4 keV, the fluorescent Fe Kα line. To model the reflected spectrum, we used the model by Magdziarz & Zdziarski (1995), reflect, and included it in all composite models. This reflection model is called angle-dependent reflection and considers the reflection depending on the viewing angle of the reflector, in this case, the WD surface. Magdziarz & Zdziarski (1995) showed that the angle-dependent reflected spectrum was similar to the average angle-reflected spectrum at the inclination μ = 0.45. Hence, we used an inclination angle fixed to 0.45 at the start of the fitting and then varied the inclination angle, which improved the fit. The amplitude parameter of the model, the reflection factor (Ω), was set free, starting from 1.0. The reflect model also has three fixed parameters: redshift, metal abundance, and iron abundance, which were all kept fixed in the fit. We used metal and iron abundances fixed at solar values for the reflection model. We checked that tying up the reflection component abundances to plasma abundances had no effect on our fit results.
Finally, we added a narrow emission line using the GAUSS model in order to account for the fluorescent iron Kα reflection line. The sigma (σ) was fixed at 1 × 10⁻³ keV, assuming a narrow line limited by the resolution of the detectors.
The collisionally ionised multi-temperature plasma in the post-shock region is the source of the X-rays and it cools by bremsstrahlung emission. We used two different isobaric cooling flow-type multi-temperature plasma models, MKCFLOW (Mushotzky & Szymkowiak 1988) and CEVMKL (Singh et al. 1996), in the different composite models to model the X-ray emission. We set the low temperature to 0.0808 keV, the minimum value allowed by the model, and the redshift parameter to 1.0 × 10⁻⁷ (for the distance of 639.4 pc obtained from Bailer-Jones et al. 2021), in the MKCFLOW model. In the CEVMKL model, we used a power law index of temperature distribution, the α parameter, fixed at 1 (for a collisionally ionised typical cooling flow model). For the CEVMKL model, when we fitted all abundances to the solar values, the plasma temperature is overestimated, and thus the intrinsic spectrum is not well represented. Instead, we set only the Fe abundance free, and this improved the fit considerably. In both plasma models we set the switch to 2, which corresponds to the use of the ATOMDB4 database. The abundance table was selected as “angr” (Anders & Grevesse 1989) using the abund command. As follows from Table 1, the MKCFLOW model was included in the composite models M1, M2, and M5, while the CEVMKL model was included in the M3, M4, and M6 composite models.
In addition, the X-ray spectrum of IGR J17195-4100 exhibits an emission line at 0.57 keV corresponding to the O VII line (He-like Oxygen line). The ionised emission line was previously found by Bernardini et al. (2012). Thus, we added a GAUSS model to all our composite models to account for this line. The sigma of this emission line was set to 1 × 10⁻³ keV, as found in the study by Bernardini et al. (2012).
The best-fit results of the X-ray analyses performed using the six composite models are presented in Table 2, with error ranges at the 90% confidence level for a single parameter. It can be seen that the model improves when we consider that the intrinsic absorbing material consists of neutral and ionised gas. The absorbing region close to the standing shock can be ionised by hard X-rays. The findings show that hard X-rays from the shock region ionise the absorber material in the system. We also obtain more consistent reflection amplitude values (Ω < 1) in the fits when the ionised absorber model was included. We find that the ionised equivalent hydrogen column density is NH ∼ 3.09 × 1022 cm−2, the coverage of the ionised material was ∼46%, and the ionisation parameter of the material is ∼1.56. In the scenario where we considered absorbing ionised gas with two different ionisation parameters (with no neutral intrinsic absorber), the fits do not improve. This shows that the neutral absorber is significant in the X-ray spectra.
To evaluate the significance of each absorption component, we calculated the F-statistic, defined as the ratio of the reduced chi-squared values (Bevington & Robinson 2003; Orlandini et al. 2012; Iyer et al. 2015). The F-statistic gives a confidence level of 99.1% (2.6σ) and 95% (1.98σ) between models M1 and M2 and models M3 and M4, respectively. This result indicates that the effects of the ionised absorbers are significant and that such effects are present in the X-ray spectra. We also compared models M5 and M6, the models with two ionised absorption models, with models M2 and M4 and obtained confidence levels of 53% (0.73 σ) and 61.7% (0.87 σ), respectively. Therefore, we cannot significantly infer the existence of two different warm absorbing regions, and the existence of a single ionised absorber or two such ionised absorbers is equally likely, since all such fits have good reduced chi-squared values around 1.1. An intrinsic neutral absorption is necessary for the X-ray spectrum, which is theoretically required for IPs (Mukai 2017).
Both plasma models describe the joint spectra well and estimate the plasma temperature to be nearly the same, along with the low solar abundance of metals or iron. The reflection amplitude (Ω) is ∼0.57, with an inclination angle, cosi, ≥0.16 when the ionised absorber model was included in the composite models. We carried out another test of the significance of the reflection effect in the X-ray spectrum using the method of Mukai et al. (2015), when we set the reflection amplitude to 0.0 in the M2 and M4 models. We used the F-test in XSPEC to compare the goodness of the fits with the cases where the reflect model was included. We observed that the plasma temperature increased to 42.7 keV and 34.7 keV (when reflect was not used), and the F-test yielded probabilities of 2 × 10⁻⁵ and 7 × 10⁻⁵, respectively, which shows that reflection significantly (over 3σ) affects X-ray spectra and hardens the spectrum, causing an overestimation of the plasma temperature, if neglected.
3.2. Spin modulation analysis
The attenuation of X-ray flux due to absorption and/or scattering leads to modulation at the spin period. We used the NuSTAR data to examine the changes in X-ray flux as a result of scattering and absorption at the spin phase, and generated spin-folded X-ray light curves using the period, 1057.3 s. In addition, different energy ranges were selected to investigate the energy dependence due to absorption or scattering. We chose four specific energy ranges, 3−5 keV, 5−10 keV, 10−20 keV, and 20−50 keV, to generate spin-folded light curves. The modulation in the different energy bands was calculated using the pulsed fraction defined as P = (Fmax − Fmin)/(Fmin + Fmax), where F denotes the X-ray flux. We obtained minimum and maximum flux values by fitting a sine model to the spin-folded light curves.
The spin pulsed profiles are displayed in Fig. 3. The spin phase zero is arbitrary in these profiles. We observe that the spin modulation does not diminish in the NuSTAR energy bands with a nearly constant value (see Table 3). The calculated pulsed fractions in Table 3 show that the modulation is slightly higher in the 20–50 keV energy range than in the lower energy ranges. Bernardini et al. (2012) found a modulation amplitude below 3.0 keV, 14±1% in the 0.3−1.0 keV energy range and 13±1% in the 1.0−3.0 keV energy range, which is too low for the photoelectric effect to dominate and more consistent with electron scattering effects (Rosen 1992). Also, since photoelectric absorption is energy dependent, E−3, we expect the modulation to decrease steeply as the energy increases. However, the spin modulation of IGR J17195-4100 does not decrease in the higher energy ranges but flattens out, pointing to electron scattering. Electron scattering can cause non-isotropic hard X-rays, leading to spin modulation in the harder X-rays, especially above 6 keV (Rosen 1992; Buckley & Tuohy 1989). Therefore, we assume that X-rays are scattered by electrons residing in the ionised gas in the system. This gas is most likely associated with the ionised absorber we detect in the source.
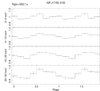 |
Fig. 3. Normalised (to average count rate) spin X-ray pulse profile of IGR J17195-4100 using the NuSTAR telescope. The phase zero is arbitrary. |
Pulse fraction (%) of X-ray spin modulation of IGR J17195-4100 in four different energy ranges.
As a further inspection, we calculated the hardness ratio (HR) using 10−20/3−5 keV and 20−50/5−10 keV energy ranges. The hardness ratio compares the number of detected photons in two energy ranges. The analysis provides an adequate comparison of the X-ray variability with respect to the spin phase in different energy bands. We carried out this analysis using FPMA and FPMB data. Figure 4 shows the hardness ratios comparing the low-energy band to the high-energy band. These results again imply the presence of scattering that is directionally dependent. As shown in Table 3, the pulsed fraction has a value around 7–9%, consistent with electron scattering, which in general shows low levels of expected modulation amplitudes in X-rays (Rosen 1992). We find that this pulsed fraction increases to 15% in the hardest X-ray band (20−50 keV). We interpret this as an effect of a Compton hump (existing Comptonisation) as a result of reflection expected in the same energy band. The increase of hardness seen in the spin phase 0.5 corresponds to the phase where the maximum X-ray flux is reached. We assume that the accretion column points away from the observer, yielding a clear view of the X-ray-emitting post-shock region. However, our interpretation requires the determination of system parameters such as the orbital inclination in order to be verified.
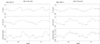 |
Fig. 4. Hardness ratio in the X-ray light curve folded at the spin period of IGR J17195-4100 using the NuSTAR telescope. The phase zero is arbitrary. |
We do not consider the self-occultation effect for spin modulation. This is the occultation of X-ray emission regions by the white dwarf as it rotates, leading to spin modulation (Evans & Hellier 2005). The spin pulse profile shows only one X-ray maximum in a phase, indicating a single pole is visible to the observer, and it does not have a large modulation depth, revealing that the inclination angle is low.
4. Discussion
The main motivation for our research was to investigate the reflection and absorption effects on X-ray emission. For this purpose, we conducted broadband X-ray spectrum analysis and spin pulse profile and hardness ratio studies.
The X-ray broadband spectra analyses were carried out in the 0.3–78 keV energy range using highly sensitive observations of IGR J17195-4100 from NuSTAR and XMM-Newton. In order to truly characterise the X-ray spectrum, several phenomena were taken into account throughout this research. Our main considerations were to study the Compton reflection effect on X-ray spectra and to determine the neutral and/or ionised nature of the absorbers. The comprehensive spectral analysis was performed by combining FPMA and FPMB data of NuSTAR in the 3.5–78.0 keV range and EPIC pn data of XMM-Newton in the 0.3–8.0 keV energy range.
We constructed six composite models to provide a good description of the broadband X-ray spectra of IGR J17195-4100. The composite models were created considering different absorption components, neutral and/or ionised, and different plasma models, MKCFLOW and CEVMKL (in XSPEC). Table 2 shows the best-fit results of six composite models with errors at the 90% confidence level. The spectral results of the CEVMKL and MKCFLOW plasma models are compatible within the uncertainties. We achieved the best fit with a reduced chi-square of 1.11/1078 and 1.08/1078 in the M2 and M4 composite models, respectively. This leads to the conclusion that broadband X-ray spectra fit well with a combination of partially covering neutral and ionised absorber models.
We obtain a plasma temperature compatible, within the error limits, with the study by Shaw et al. (2020). Since Shaw et al. (2020) eliminate absorption and reflection effects using energy >20 keV, the approximate plasma temperature result obtained from the broadband X-ray analysis indicates that the composite models we used represent reflection and absorption effects well. Thus, accounting for both the reflection and the ionised absorptions allows us to obtain the true plasma temperature.
We find the hydrogen column density and covering fraction of the neutral absorber model to be 14.51 × 1022 cm−2 and 11.82 × 1022 cm−2 with 42% and 38% covering fractions using the models M2 and M4, respectively. In contrast to previous studies, the neutral absorber values we measure are higher (Girish & Singh 2012; Bernardini et al. 2012; Butters et al. 2008). On the other hand, using the M1 and M3 models, which include only a neutral absorber model, slightly lower neutral absorber values (lower by a factor of two) are calculated, which are less than the values found in previous studies, except for that of Butters et al. (2008), which found a neutral absorber of 0.7 × 1022 cm−2 in the 2.5–20 keV energy range.
Although ionised absorbers have been the subject of several investigations for IPs (Islam & Mukai 2021; Dutta & Rana 2022; Joshi et al. 2023; Pekön & Balman 2012), they were considered for the first time for spectral analysis of IGR J17195-4100. The equivalent hydrogen column density is found to be (2.6–5.4) × 1022 cm−2, with a 44–54% covering fraction. The ionisation parameter is found to be almost the same, log(ξ) = 1.47 and 1.46, in models M2 and M4, respectively. As we highlighted earlier, accounting for the presence of an ionised absorber in the system improves the fits and provides an essential contribution to the X-ray spectral analysis.
The effect of Compton reflection on the X-ray emission in IP systems has been considered by several studies (van Teeseling et al. 1996; Beardmore et al. 1995, 2000; Done et al. 1995; Hayashi et al. 2011, 2021, 2018; Mukai et al. 2015; Cropper et al. 1998; Revnivtsev et al. 2004). The hard X-ray photons can be downscattered by relatively cold electrons, leading to a Compton Hump in the energy range 10–30 keV. In this research, we investigated the significance of reflection in the X-ray emission of IGR J17195-4100 for the first time by inserting an angle-dependent reflection model, reflect, in all composite models. We obtain larger reflection amplitudes using models M1 and M3 that include only the neutral absorber. After adding the ionised absorber model to our composite models, we achieve a reflection amplitude smaller than 1. We suggest that the ionised absorber model fits the spectra well and provides more consistent values for the reflection amplitude in the spectral analysis. The results of the F-test performed on models M2 and M4 reveal that the reflection has a significance of more than 3σ in the X-ray emission, leading to an overestimation of the plasma temperature of IGR J17195-4100 by about 30% if the reflection effect is ignored. Therefore, taking into account the reflection effect on X-ray emission is necessary to accurately characterise the spectral parameters of the system.
The Galactic column density along the line of sight of IGR J17195-4100 is 0.6 × 1022 cm−2, estimated using HI4PI Collaboration (2016). As shown in Table 2, the absorption from the interstellar medium is found to be lower than expected. Previous analyses also obtained a slightly lower absorption for the interstellar medium (Tomsick et al. 2006; Bernardini et al. 2012; Girish & Singh 2012). Since the low NH value fits this soft region well, we did not include additional plasma models such as a MEKAL model to account for the slight soft excess.
An ionised oxygen line, O VII, observed at 0.57 keV is detected in the studies by Bernardini et al. (2012) and Maiolino et al. (2021) studies. We also detect this O VII emission line at 0.57 keV in our study and model it with a GAUSS model. This emission line can be interpreted as further evidence of the presence of ionised material in the system. In addition, Bernardini et al. (2012) detected three more emission lines, O VIII, Ne IX, and Ne X, observed at 0.65 keV, 0.92 keV, and 1.02 keV, respectively. We do not include these lines as we do not find them to be significant in our spectral analysis. We note that the RGS spectra (1,2) are indicative of residual variations that may be of absorption features, but no significant result can be obtained since the sensitivity difference between EPIC pn and RGS is about 0.01–0.005 considering the RGS energy range, which effectively degrades flux.
The unabsorbed X-ray luminosity in the energy range 0.3–78.0 keV is calculated as 5.2 × 1033 erg s−1 using the XSPEC task flux and a distance of 621.8 pc (Bailer-Jones et al. 2021). We also calculate a mass accretion rate of 3.1 × 10¹⁶ g s−1 using a WD radius of 6.7 × 108 cm from the mass–radius relationship (Nauenberg 1972), assuming a WD mass of 0.84 M⊙ (Shaw et al. 2020). Furthermore, we calculated the distance of ionised absorber from the X-ray source using a number density of 1015 cm−3 (Mukai 2017) and a log(ξ) of 1.46 from the results of model M4. We obtain this distance to be 4 × 108 cm, pointing to a region close to the WD, likely the accretion curtain.
The spin pulse profile and hardness ratios are shown in Figs. 3 and 4, respectively. The energy bands in the hard X-rays still show modulations at the spin period with an almost constant modulation percentage that increases slightly in the 20–50 keV range. The modulation in the soft X-ray bands is expected to occur due to photoelectric absorption, which is energy dependent. As the energy increases, the modulation caused by photoelectric absorption is expected to gradually decrease. But in the NuSTAR bands above 3 keV and even above 10 keV, we still observe modulation, as seen in Table 3. We attribute this low percentage modulation in the hard bands to electron scattering (Rosen 1992; Buckley & Tuohy 1989). The X-ray photons can be scattered from free electrons, causing modulation due to the change in the direction of the X-ray photons. We observe the pulse peaks in more or less the same spin phase as the modulation in most bands, so we see the same geometry. We believe that the maximum X-ray flux is reached when the pole points away from the observer, and that when the pole points towards the observer, the X-ray photons are absorbed and scattered by the accretion flow, resulting in modulation in the same spin phase. Furthermore, in the case of a small ΔR/R, scattering occurs close to the WD surface (see Fig. 4 of Rosen 1992), resulting in both effects being observed in the same phase. We note that we did not conduct phase-resolved spectroscopy of the source because of the low modulation amplitude of ∼10% over almost the entire band of 0.3–78.0 keV, which may not properly allow for a good statistical separation of the spectra at different phases.
Hayashi et al. (2018) clearly show that the reflected spectrum depends on the mass of the WD, the abundances, the specific accretion rate, and the inclination angle. Assuming the distance of the ionised material (absorber) from the X-ray source as an estimate for the height of the accretion column, 4 × 108 cm, and with RWD calculated as 6.7 × 108 cm, we can assume that the WD has a tall accretion column. In the scenario of a tall accretion column, our findings are consistent with the Hayashi et al. (2018) study. Since the tall accretion column reduces the solid angle of the WD, it can reduce the Compton hump, especially at large viewing angles (see Fig. 6 of Hayashi et al. 2018). This could explain the low reflection amplitude, Ω < 1, obtained in the composite models M2, M4, M5, and M6, which are the best-fit results we achieved (see Table 2).
5. Conclusions
MCVs and IPs comprise more than 30% of the cataclysmic variables population and they are known, particularly in the case of IPs, to be the hardest X-ray emitters and perhaps the brightest in this regard. MCVs are readily detected in X-ray surveys (XMM-Newton, Swift, INTEGRAL) and studied since they have luminosities several times 10(30 − 34) erg/s contributing to the Galactic X-ray luminosity function; they also play a crucial role in understanding Galactic X-ray binary populations (see de Martino et al. 2020; Lutovinov et al. 2020, for the surveys). As a result, understanding the spectral characteristics and their hard X-ray emission becomes essential, in general, to be able to classify and study this class of emitters. Therefore, we took a previously known hard X-ray IP, IGR J17195-4100, and investigated the hard X-ray spectrum in a broad range (0.3–78.0 keV) using joint XMM-Newton and NuSTAR data to see how reflection and ionised absorption affects the spectrum of this source. We find that reflection from the surface of the WD in the system is consistent with the spectral characteristics at greater than a 3σ confidence level. We also observe that models including both partially ionised and neutral absorber models better represent the soft X-ray spectra, indicating that ionised absorbers (i.e. warm absorbing regions) are present in the system, along with neutral absorbing gas. Both of these characteristics harden the broadband X-ray spectrum. These also indicate that Compton scattering and electron scattering are influential on the broadband X-ray spectrum.
The investigation of the ionised and neutral absorbers along with the reflection effect on the X-ray spectra helps us predict the system mechanism. The ionisation parameter, log(ξ), derived from the best-fit results indicates that ionised material is present, along with neutral material, in the accretion column. The calculated distance of the ionised absorbing material led us to consider the tall shock scenario.
In this tall accretion column scenario, where the WD will subtend a smaller solid angle, we measure a relatively smaller reflection amplitude, Ω < 1, together with a cos i > 0.2, consistent with the previous theoretical calculations on the reflection effect and its spectrum. We also find that the low metal abundances we obtain are consistent with the expected equivalent width of the Fe Kα fluorescent line source detected by Bernardini et al. (2012). Nevertheless, the underlying origin of the low metal abundance and low iron abundance of IGR J17195-4100 observed in both plasma models and in previous studies is not well understood.
Spin modulation analysis reveals that the X-rays are under the effect of low photoelectric absorption and electron scattering with a modulation amplitude of about 8–14% over the 0.3–78.0 keV energy band. The modulation observed at high energies can be explained by electron scattering in particular, which can change the direction of the X-ray photons as reported by Rosen (1992).
We conclude that both reflection and ionised absorber effects characterise the X-ray spectrum of IGR J17195-4100 with high significance, and should be considered when analysing X-ray emission to obtain the intrinsic source emissions in the X-rays.
E = Channel Number * 0.04 keV + 1.6 keV
Acknowledgments
We would like to thank the anonymous referee for useful comments and valuable suggestions that improved the quality of the manuscript. This paper is jointly led by EŞ and ŞB, which formed a major part of the MS thesis of EŞ (supervisor ŞB), accepted by Istanbul University, Dept. of Astronomy and Space Sciences and Institute of Sciences. EŞ and ŞB acknowledge support by the Scientific Research Projects Coordination Unit of Istanbul University through the BAP Project No: 40017. EŞ acknowledges funding by l’Agència de Gestió d’Ajuts Universitaris i de Recerca (AGAUR) Generalitat de Catalunya official predoctoral program under the FI-SDUR grant (2023-FISDU-00225). EŞ and GS acknowledge support by the Spanish MINECO grant PID2023-148661NB-I00, by the E.U. FEDER funds, and by the AGAUR/Generalitat de Catalunya grant SGR-386/2021. This research is based on observations obtained with XMM-Newton, and NuSTAR. The former is an ESA science mission with instruments and contributions directly funded by ESA Member States and the National Aeronautics and Space Administration, NASA and the latter is a mission led by the California Institute of Technology, managed by the Jet Propulsion Laboratory, and funded by NASA.
References
- Anders, E., & Grevesse, N. 1989, Geochim. Cosmochim. Acta, 53, 197 [Google Scholar]
- Arnaud, K. A. 1996, in Astronomical Data Analysis Software and Systems V, eds. G. H. Jacoby, & J. Barnes, ASP Conf. Ser., 101, 17 [NASA ADS] [Google Scholar]
- Bailer-Jones, C. A. L., Rybizki, J., Fouesneau, M., Demleitner, M., & Andrae, R. 2021, AJ, 161, 147 [Google Scholar]
- Balman, S. 2012, Mem. Soc. Astron. It., 83, 585 [NASA ADS] [Google Scholar]
- Balman, Ş., Khamitov, I., Kolbin, A., et al. 2024, A&A, 684, A190 [NASA ADS] [CrossRef] [EDP Sciences] [Google Scholar]
- Barlow, E. J., Knigge, C., Bird, A. J., et al. 2006, MNRAS, 372, 224 [NASA ADS] [CrossRef] [Google Scholar]
- Beardmore, A. P., Done, C., Osborne, J. P., & Ishida, M. 1995, MNRAS, 272, 749 [NASA ADS] [Google Scholar]
- Beardmore, A. P., Osborne, J. P., & Hellier, C. 2000, MNRAS, 315, 307 [Google Scholar]
- Bernardini, F., de Martino, D., Falanga, M., et al. 2012, A&A, 542, A22 [NASA ADS] [CrossRef] [EDP Sciences] [Google Scholar]
- Bevington, P. R., & Robinson, D. K. 2003, Data Reduction and Error Analysis for the Physical Sciences (Boston, MA: McGraw-Hill) [Google Scholar]
- Bird, A. J., Barlow, E. J., Bassani, L., et al. 2004, ApJ, 607, L33 [NASA ADS] [CrossRef] [Google Scholar]
- Buckley, D. A. H., & Tuohy, I. R. 1989, ApJ, 344, 376 [NASA ADS] [CrossRef] [Google Scholar]
- Butters, O. W., Norton, A. J., Hakala, P., Mukai, K., & Barlow, E. J. 2008, A&A, 487, 271 [NASA ADS] [CrossRef] [EDP Sciences] [Google Scholar]
- Cropper, M., Ramsay, G., & Wu, K. 1998, MNRAS, 293, 222 [NASA ADS] [CrossRef] [Google Scholar]
- de Martino, D., Bernardini, F., Mukai, K., Falanga, M., & Masetti, N. 2020, Adv. Space Res., 66, 1209 [Google Scholar]
- Done, C., & Magdziarz, P. 1998, MNRAS, 298, 737 [NASA ADS] [CrossRef] [Google Scholar]
- Done, C., Osborne, J. P., & Beardmore, A. P. 1995, MNRAS, 276, 483 [Google Scholar]
- Dutta, A., & Rana, V. 2022, ApJ, 940, 100 [Google Scholar]
- Evans, P. A., & Hellier, C. 2004, MNRAS, 353, 447 [NASA ADS] [CrossRef] [Google Scholar]
- Evans, P. A., & Hellier, C. 2005, MNRAS, 359, 1531 [Google Scholar]
- Ezuka, H., & Ishida, M. 1999, ApJS, 120, 277 [NASA ADS] [CrossRef] [Google Scholar]
- Fabian, A. C., Pringle, J. E., & Rees, M. J. 1976, MNRAS, 175, 43 [Google Scholar]
- George, I. M., & Fabian, A. C. 1991, MNRAS, 249, 352 [Google Scholar]
- Girish, V., & Singh, K. P. 2012, MNRAS, 427, 458 [Google Scholar]
- Harrison, F. A., Craig, W. W., Christensen, F. E., et al. 2013, ApJ, 770, 103 [Google Scholar]
- Hayashi, T., Ishida, M., Terada, Y., Bamba, A., & Shionome, T. 2011, PASJ, 63, S739 [Google Scholar]
- Hayashi, T., Kitaguchi, T., & Ishida, M. 2018, MNRAS, 474, 1810 [Google Scholar]
- Hayashi, T., Kitaguchi, T., & Ishida, M. 2021, MNRAS, 504, 3651 [NASA ADS] [CrossRef] [Google Scholar]
- Hellier, C. 1993, MNRAS, 265, L35 [Google Scholar]
- HI4PI Collaboration (Ben Bekhti, N., et al.) 2016, A&A, 594, A116 [NASA ADS] [CrossRef] [EDP Sciences] [Google Scholar]
- Hōshi, R. 1973, Progr. Theoret. Phys., 49, 776 [Google Scholar]
- Hua, X.-M., & Lingenfelter, R. E. 1992, ApJ, 397, 591 [Google Scholar]
- Islam, N., & Mukai, K. 2021, ApJ, 919, 90 [NASA ADS] [CrossRef] [Google Scholar]
- Iyer, N., Mukherjee, D., Dewangan, G. C., Bhattacharya, D., & Seetha, S. 2015, MNRAS, 454, 741 [NASA ADS] [CrossRef] [Google Scholar]
- Jansen, F., Lumb, D., Altieri, B., et al. 2001, A&A, 365, L1 [NASA ADS] [CrossRef] [EDP Sciences] [Google Scholar]
- Joshi, A., Rawat, N., Schwope, A., et al. 2023, MNRAS, 521, 6156 [Google Scholar]
- Kim, Y., & Beuermann, K. 1995, A&A, 298, 165 [NASA ADS] [Google Scholar]
- Lightman, A. P., & White, T. R. 1988, ApJ, 335, 57 [NASA ADS] [CrossRef] [Google Scholar]
- Lumb, D. H., Schartel, N., & Jansen, F. A. 2012, Opt. Eng., 51, 011009 [NASA ADS] [CrossRef] [Google Scholar]
- Luna, G. J. M., Mukai, K., Orio, M., & Zemko, P. 2018, ApJ, 852, L8 [NASA ADS] [CrossRef] [Google Scholar]
- Lutovinov, A., Suleimanov, V., Manuel Luna, G. J., et al. 2020, New Astron. Rev., 91, 101547 [Google Scholar]
- Madsen, K. K., Harrison, F. A., Markwardt, C. B., et al. 2015, ApJS, 220, 8 [Google Scholar]
- Magdziarz, P., & Zdziarski, A. A. 1995, MNRAS, 273, 837 [Google Scholar]
- Maiolino, T., Titarchuk, L., Wang, W., Frontera, F., & Orlandini, M. 2021, ApJ, 911, 80 [NASA ADS] [CrossRef] [Google Scholar]
- Masetti, N., Morelli, L., Palazzi, E., et al. 2006, A&A, 459, 21 [NASA ADS] [CrossRef] [EDP Sciences] [Google Scholar]
- Mukai, K. 2017, PASP, 129, 062001 [Google Scholar]
- Mukai, K., Rana, V., Bernardini, F., & de Martino, D. 2015, ApJ, 807, L30 [NASA ADS] [CrossRef] [Google Scholar]
- Mushotzky, R. F., & Szymkowiak, A. E. 1988, in Cooling Flows in Clusters and Galaxies, ed. A. C. Fabian, NATO Advanced Study Institute (ASI) Series C, 229, 53 [Google Scholar]
- Nauenberg, M. 1972, ApJ, 175, 417 [NASA ADS] [CrossRef] [Google Scholar]
- Norton, A. J., & Watson, M. G. 1989, MNRAS, 237, 853 [Google Scholar]
- Norton, A. J., Hellier, C., Beardmore, A. P., et al. 1997, MNRAS, 289, 362 [NASA ADS] [Google Scholar]
- Orlandini, M., Frontera, F., Masetti, N., Sguera, V., & Sidoli, L. 2012, ApJ, 748, 86 [NASA ADS] [CrossRef] [Google Scholar]
- Parker, T. L., Norton, A. J., & Mukai, K. 2005, A&A, 439, 213 [NASA ADS] [CrossRef] [EDP Sciences] [Google Scholar]
- Patterson, J. 1994, PASP, 106, 209 [Google Scholar]
- Pekön, Y., & Balman, Ş. 2012, AJ, 144, 53 [Google Scholar]
- Pretorius, M. L. 2009, MNRAS, 395, 386 [NASA ADS] [CrossRef] [Google Scholar]
- Reeves, J., Done, C., Pounds, K., et al. 2008, MNRAS, 385, L108 [Google Scholar]
- Revnivtsev, M., Lutovinov, A., Suleimanov, V., Sunyaev, R., & Zheleznyakov, V. 2004, A&A, 426, 253 [NASA ADS] [CrossRef] [EDP Sciences] [Google Scholar]
- Rosen, S. R. 1992, MNRAS, 254, 493 [NASA ADS] [CrossRef] [Google Scholar]
- Rothschild, R. E., Gruber, D. E., Knight, F. K., et al. 1981, ApJ, 250, 723 [Google Scholar]
- Shaw, A. W., Heinke, C. O., Mukai, K., et al. 2020, MNRAS, 498, 3457 [NASA ADS] [CrossRef] [Google Scholar]
- Singh, K. P., White, N. E., & Drake, S. A. 1996, ApJ, 456, 766 [NASA ADS] [CrossRef] [Google Scholar]
- Suleimanov, V. F., Doroshenko, V., & Werner, K. 2019, MNRAS, 482, 3622 [NASA ADS] [CrossRef] [Google Scholar]
- Tomsick, J. A., Chaty, S., Rodriguez, J., et al. 2006, ApJ, 647, 1309 [NASA ADS] [CrossRef] [Google Scholar]
- van Teeseling, A., Kaastra, J. S., & Heise, J. 1996, A&A, 312, 186 [NASA ADS] [Google Scholar]
- Warner, B. 1995, Cataclysmic Variable Stars, 28 [CrossRef] [Google Scholar]
- Yuasa, T., Nakazawa, K., Makishima, K., et al. 2010, A&A, 520, A25 [NASA ADS] [CrossRef] [EDP Sciences] [Google Scholar]
All Tables
Best-fit spectral parameters of the source IGR J17195-4100 with errors at 90% confidence level.
Pulse fraction (%) of X-ray spin modulation of IGR J17195-4100 in four different energy ranges.
All Figures
|
Fig. 1. Fitted X-ray spectrum of IGR J17195-4100 obtained from XMM-Newton (black), NuSTAR/FPMA(red), and NuSTAR/FPMB (green). Left: Fit with the composite model M3. Right: Fit with the composite model M4 (right). The second panel shows the residuals in standard deviations. |
| In the text | |
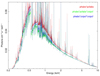 |
Fig. 2. Fitted absorption components as in Table 2. Composite models represented are M3, M4, and M6. |
| In the text | |
|
Fig. 3. Normalised (to average count rate) spin X-ray pulse profile of IGR J17195-4100 using the NuSTAR telescope. The phase zero is arbitrary. |
| In the text | |
|
Fig. 4. Hardness ratio in the X-ray light curve folded at the spin period of IGR J17195-4100 using the NuSTAR telescope. The phase zero is arbitrary. |
| In the text | |
Current usage metrics show cumulative count of Article Views (full-text article views including HTML views, PDF and ePub downloads, according to the available data) and Abstracts Views on Vision4Press platform.
Data correspond to usage on the plateform after 2015. The current usage metrics is available 48-96 hours after online publication and is updated daily on week days.
Initial download of the metrics may take a while.