Open Access
Fig. 9
Download original image
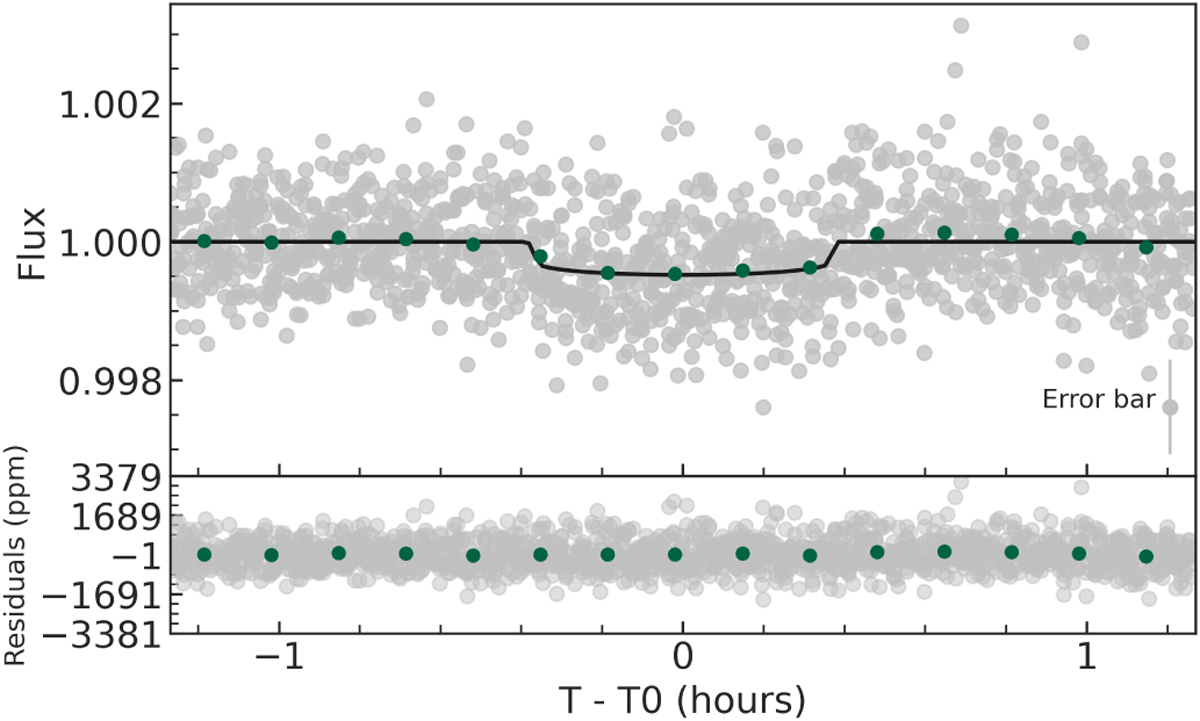
TESS transit light curve phase-folded at the orbital period of TOI-2427 b (gray dots), 10−min binned light curve (green dots), and model derived from the medians of the marginalized posterior distributions of the inferred transit parameters (thick line).
Current usage metrics show cumulative count of Article Views (full-text article views including HTML views, PDF and ePub downloads, according to the available data) and Abstracts Views on Vision4Press platform.
Data correspond to usage on the plateform after 2015. The current usage metrics is available 48-96 hours after online publication and is updated daily on week days.
Initial download of the metrics may take a while.