Fig. 10
Download original image
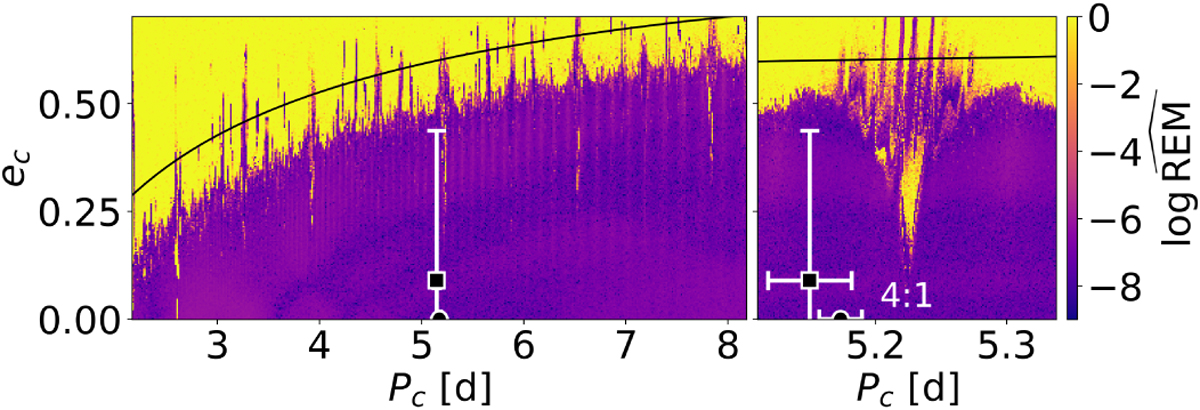
Dynamical map for the solution presented in Table 4 for a wide range of orbital periods and eccentricities of the outer non-transiting planet c. The narrow right panel presents a close-up of the scan for the 3 σ region around the orbital period of the planet c in the circular model (black filled circle with a white rim) and for the 3 σ region around the orbital period and eccentricity of planet c in a model with eccentricities as free parameters (filled black square with white rim). Small values of the fast indicator ![]() characterizes regular (longterm stable) solutions, which are marked with black/dark blue color. Chaotic solutions are marked with brighter colors, up to yellow. The black line represents the so-called collision curve of orbits, defined by the condition: ab(1+eb)=ac(1−ec). The resolution for the left plot is 401 × 201 points, while that for the right plot is 201 × 201 points. “The initial conditions were calculated for each point of the scan while keeping the time of the first transit fixed.”
characterizes regular (longterm stable) solutions, which are marked with black/dark blue color. Chaotic solutions are marked with brighter colors, up to yellow. The black line represents the so-called collision curve of orbits, defined by the condition: ab(1+eb)=ac(1−ec). The resolution for the left plot is 401 × 201 points, while that for the right plot is 201 × 201 points. “The initial conditions were calculated for each point of the scan while keeping the time of the first transit fixed.”
Current usage metrics show cumulative count of Article Views (full-text article views including HTML views, PDF and ePub downloads, according to the available data) and Abstracts Views on Vision4Press platform.
Data correspond to usage on the plateform after 2015. The current usage metrics is available 48-96 hours after online publication and is updated daily on week days.
Initial download of the metrics may take a while.