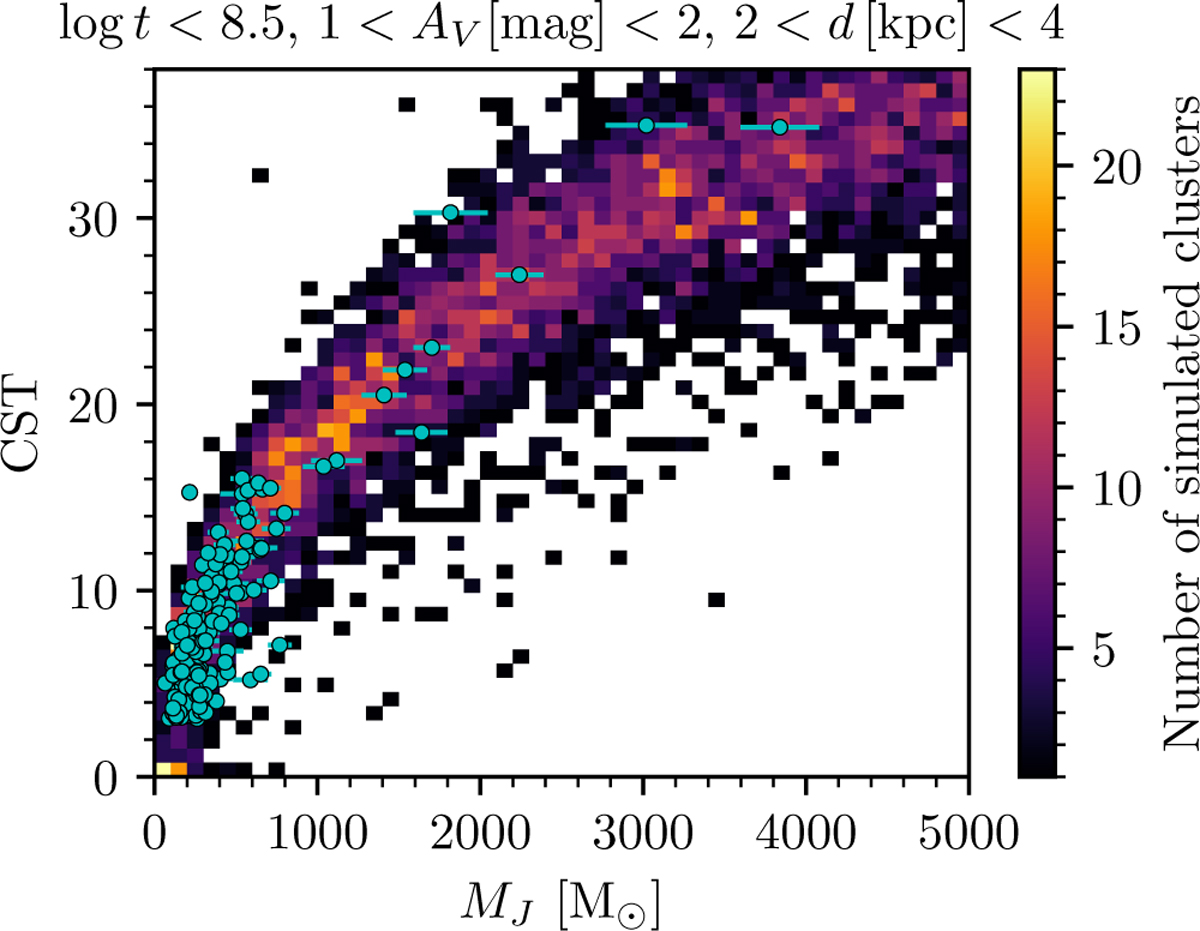
Fig. 7
Download original image
Comparison between the CST of simulated and real clusters in a restricted parameter range as a function of cluster mass. Simulated clusters are shown by the heatmap in the background, while clusters in HR23 are shown by the blue points, plotted as a function of their mass and associated uncertainty from HR24. We use the Jacobi mass MJ from HR24, which measures the mass of the bound part of an OC, as MJ is the most comparable cluster mass to the simulated cluster masses in this study. Only clusters with log t < 8.5, 1 < AV < 2, and 2 < d < 4 kpc are shown.
Current usage metrics show cumulative count of Article Views (full-text article views including HTML views, PDF and ePub downloads, according to the available data) and Abstracts Views on Vision4Press platform.
Data correspond to usage on the plateform after 2015. The current usage metrics is available 48-96 hours after online publication and is updated daily on week days.
Initial download of the metrics may take a while.