Fig. 6
Download original image
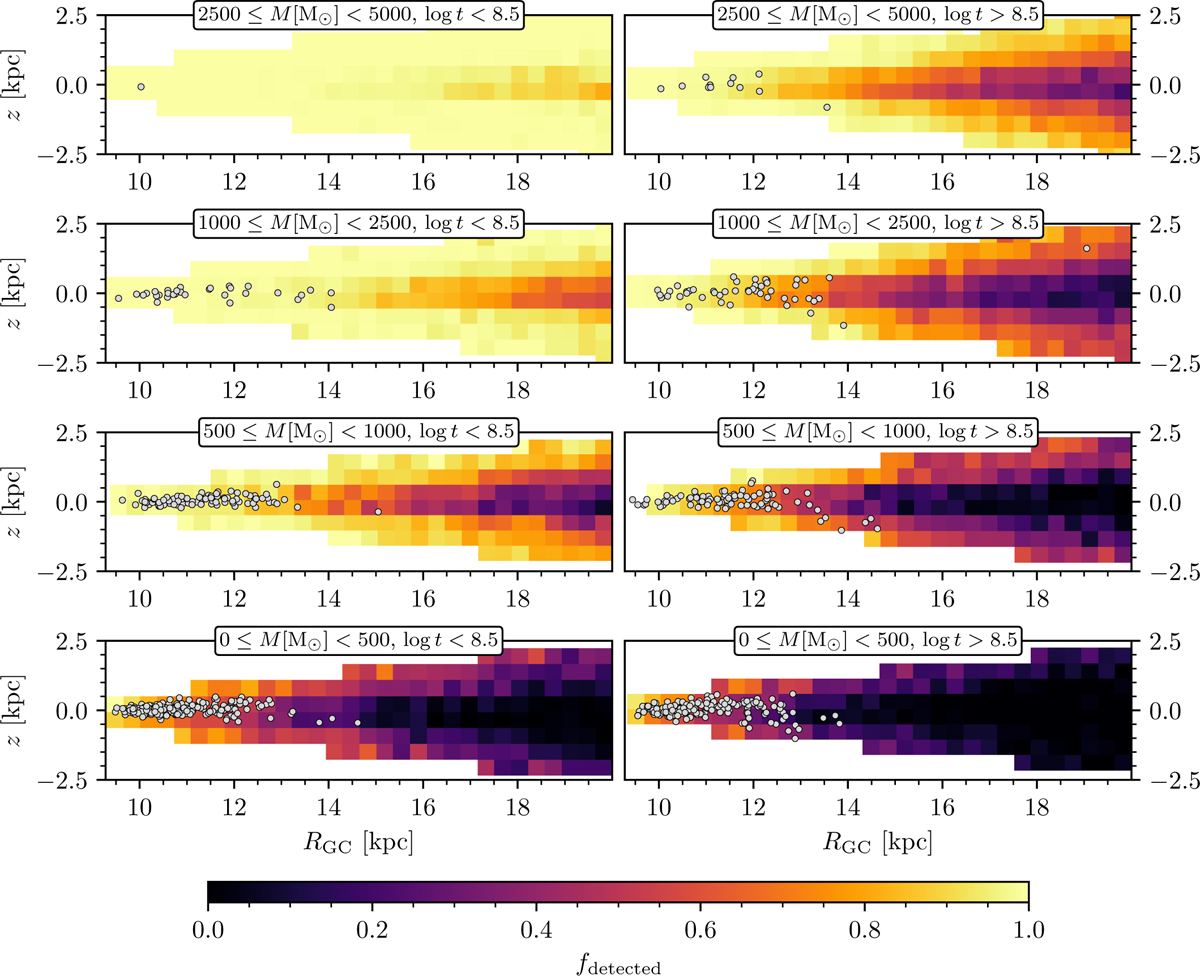
Fraction of simulated clusters recovered as a function of RGC and Z divided into multiple different mass and ages ranges, and compared against the distribution of OCs in HR24 within those ranges. Each row shows clusters in a different mass range, indicated by the label on each subplot. The subplots in the left column show young clusters with log t < 8.5, while subplots in the right column show old clusters with log t > 8.5. Although proper motions only have a small impact on cluster detectability, we nevertheless only show the detection results of simulated clusters with proper motions |μα*| < 2.5 and |μδ| < 2.5, providing a slightly more conservative estimate on cluster detectability at these locations.
Current usage metrics show cumulative count of Article Views (full-text article views including HTML views, PDF and ePub downloads, according to the available data) and Abstracts Views on Vision4Press platform.
Data correspond to usage on the plateform after 2015. The current usage metrics is available 48-96 hours after online publication and is updated daily on week days.
Initial download of the metrics may take a while.