Fig. 5
Download original image
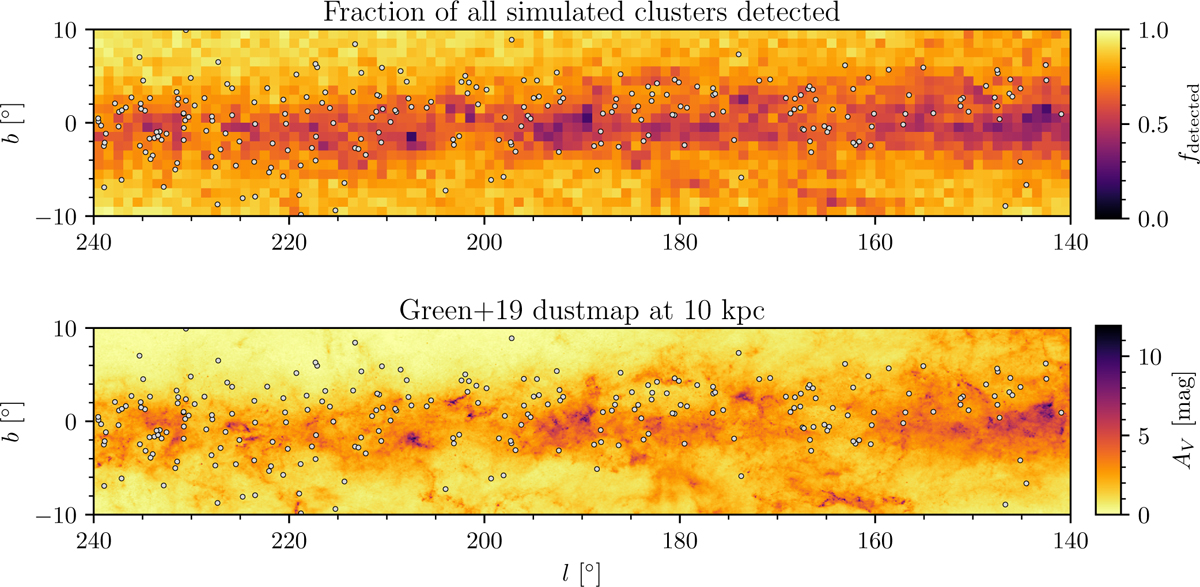
Fraction of simulated clusters recovered compared to the input dust distribution in this study. Top: fraction of all simulated clusters recovered in this work as a function of l and b. Clusters were binned in bins of size 1° × 1°. Grey circles show the distribution of high-quality OCs in HR24 with CST > 5, d > 3 kpc, and a CMD class of better than 0.5. Bottom: as above, but instead showing the total Green et al. (2019) extinction in the V band at a distance of 10 kpc overlaid with real OCs.
Current usage metrics show cumulative count of Article Views (full-text article views including HTML views, PDF and ePub downloads, according to the available data) and Abstracts Views on Vision4Press platform.
Data correspond to usage on the plateform after 2015. The current usage metrics is available 48-96 hours after online publication and is updated daily on week days.
Initial download of the metrics may take a while.