Fig. 4
Download original image
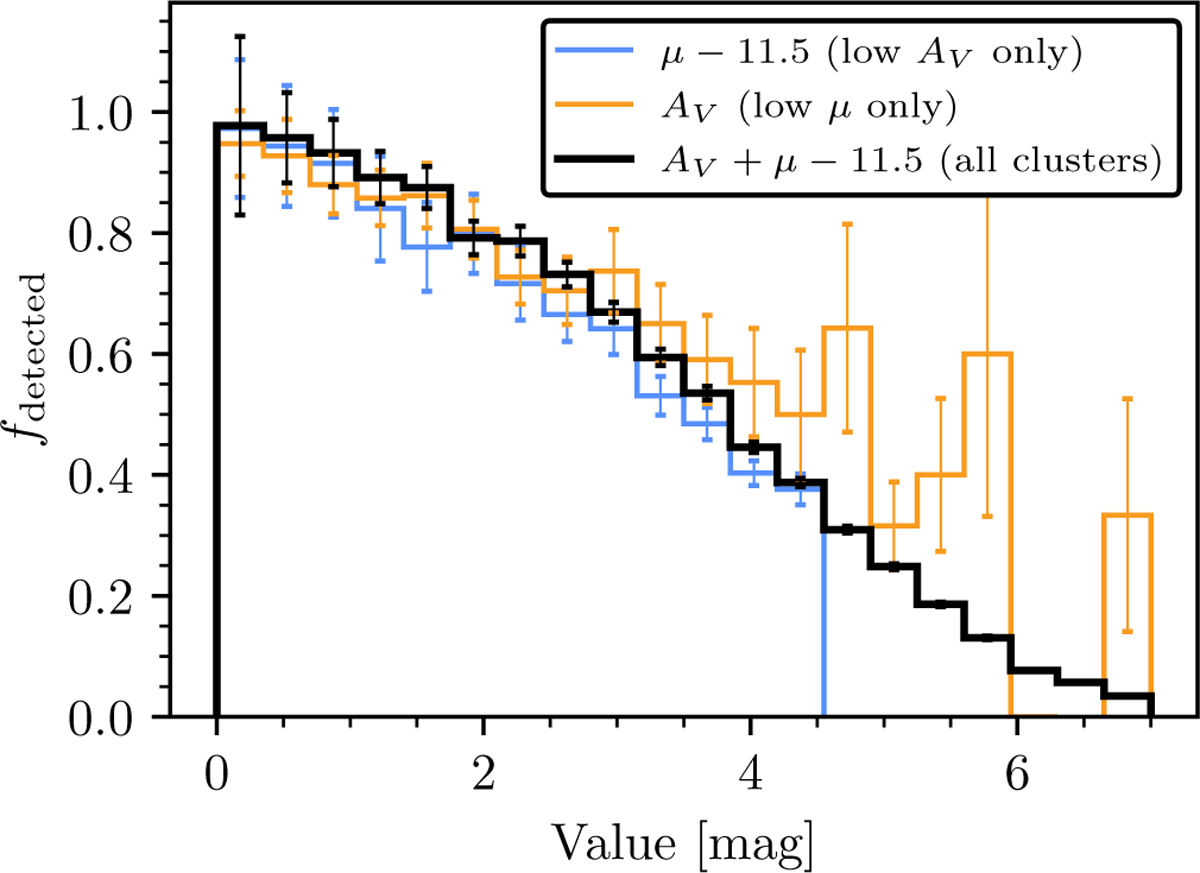
Comparison between the impact of extinction AV and distance modulus μ on cluster detectability, for clusters with a mass below 800 M . The blue curve shows fdetected as a function of distance modulus μ for simulated clusters with negligible extinction (AV < 0.5), while the orange curve shows fdetected as a function of AV for the nearest clusters in this study (2 < d [kpc] < 3). A correction of 11.5 (the distance modulus corresponding to a distance of 2 kpc) was subtracted from the distance modulus to make its value in this study start at zero, and hence be easily comparable with AV, which also has a minimum value of zero in this work. The black curve shows fdetected for μ and AV summed for all simulated clusters. Poisson uncertainties are shown on the bins.
Current usage metrics show cumulative count of Article Views (full-text article views including HTML views, PDF and ePub downloads, according to the available data) and Abstracts Views on Vision4Press platform.
Data correspond to usage on the plateform after 2015. The current usage metrics is available 48-96 hours after online publication and is updated daily on week days.
Initial download of the metrics may take a while.