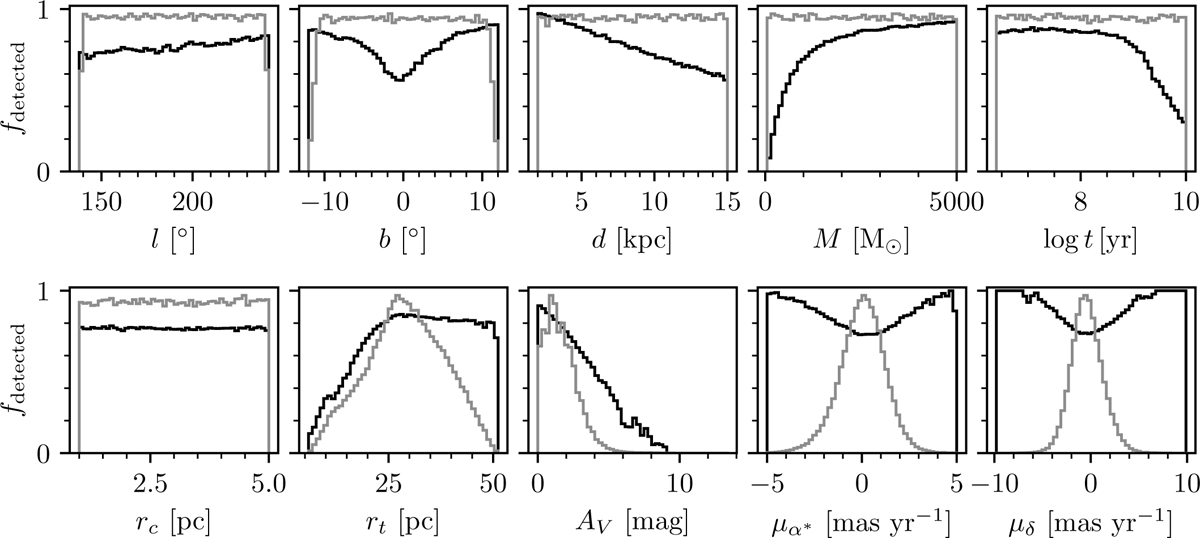
Fig. 3
Download original image
Trends in cluster detectability as a function of ten cluster parameters for the simulated cluster injection and retrievals in this work. In each subplot, the black line shows the fraction of clusters detected, fdetected, while marginalising over all other parameters. For comparison, the grey line shows the distribution of injected clusters in this work, normalised to have a maximum at one. The top row of plots and the first on the lower row show intrinsic parameters, which are those chosen during this study; the remaining parameters rt, AV, μα*, and μδ are all a function of these intrinsic parameters, but are nevertheless shown here for illustrative purposes. Figure A.1 shows the covariances between the most significant of these parameters.
Current usage metrics show cumulative count of Article Views (full-text article views including HTML views, PDF and ePub downloads, according to the available data) and Abstracts Views on Vision4Press platform.
Data correspond to usage on the plateform after 2015. The current usage metrics is available 48-96 hours after online publication and is updated daily on week days.
Initial download of the metrics may take a while.