Fig. 2
Download original image
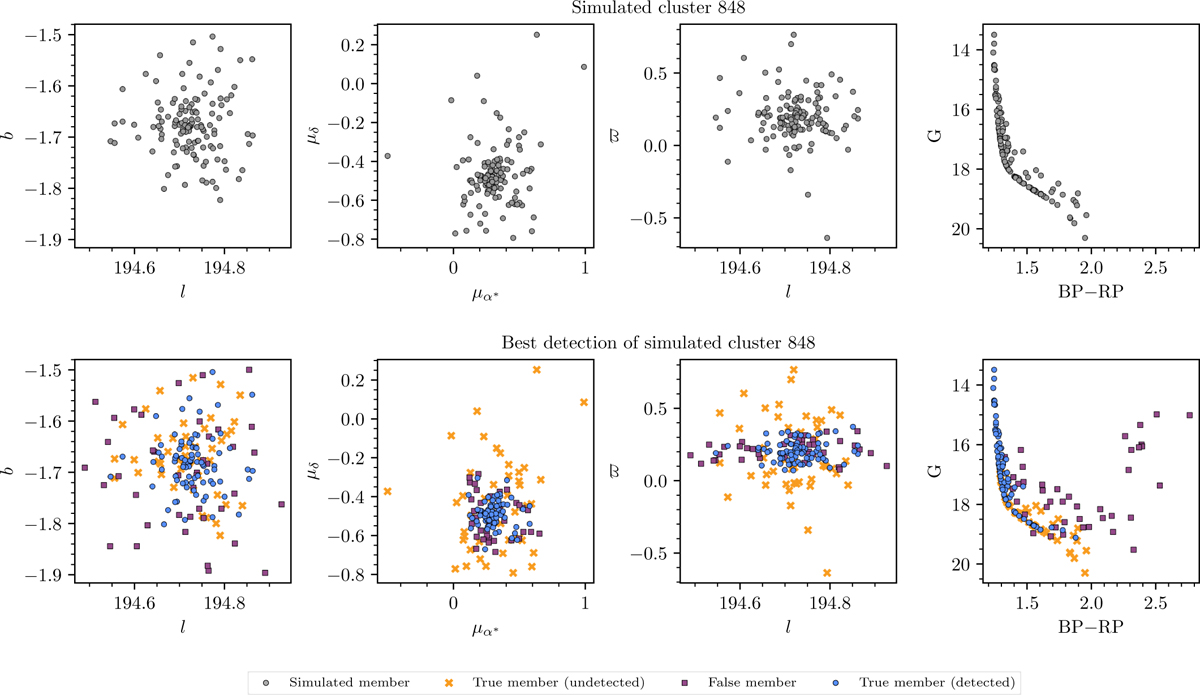
Example result of the injection-recovery procedure for a simulated OC, in the typical projections used in cluster discovery studies. Top row: original simulated cluster (including realistic Gaia DR3-like astrometric errors), shown in position (far left), proper motion (centre left), position versus parallax (centre right), and the colour-magnitude diagram of the cluster (far right). This simulated cluster was then inserted into Gaia data to test the cluster recovery ability of HDBSCAN. Bottom row: same as top row, but for the best recovery from Gaia data of this cluster by HDBSCAN. True members of the cluster that were correctly assigned as members by HDBSCAN are shown as blue circles. Non-member field stars from the Gaia dataset that were incorrectly added to the cluster are shown as purple squares. Finally, member stars that HDBSCAN missed are shown as orange crosses.
Current usage metrics show cumulative count of Article Views (full-text article views including HTML views, PDF and ePub downloads, according to the available data) and Abstracts Views on Vision4Press platform.
Data correspond to usage on the plateform after 2015. The current usage metrics is available 48-96 hours after online publication and is updated daily on week days.
Initial download of the metrics may take a while.