Fig. C.1
Download original image
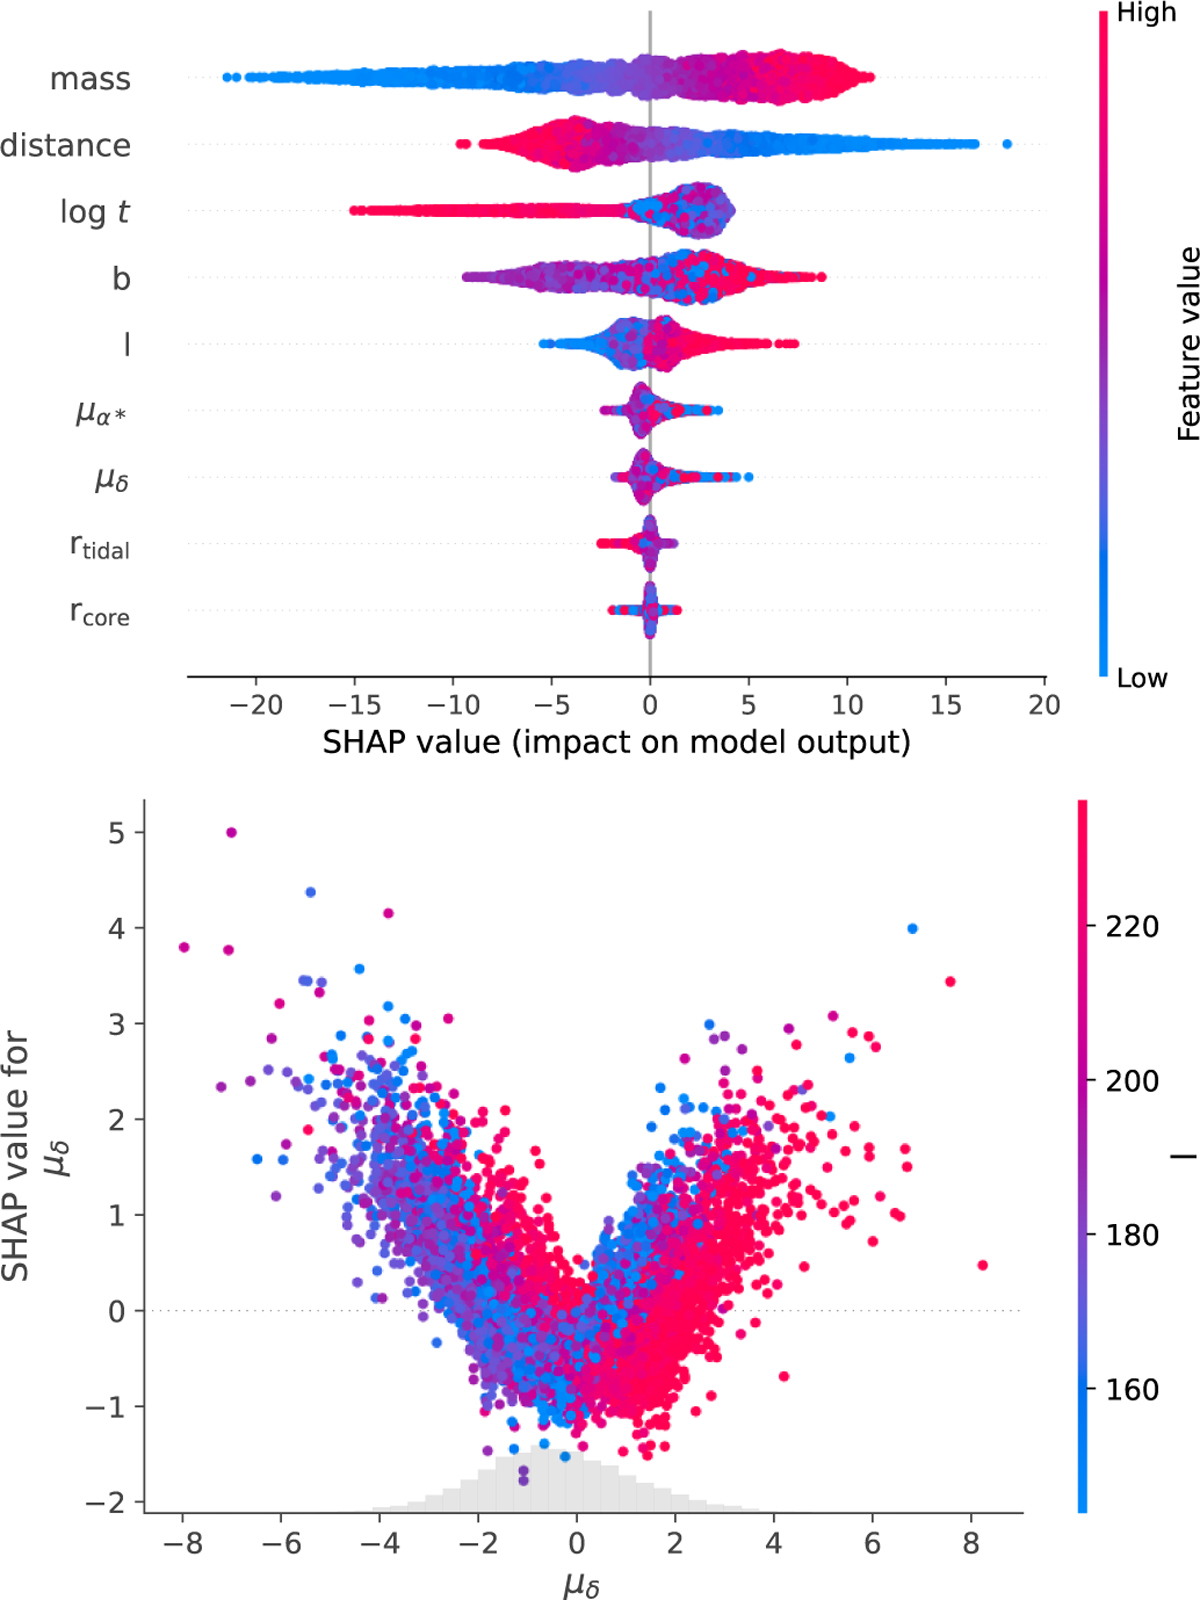
SHAP feature importance values for the CST predictor. Top: Beeswarm plot where each cluster in the validation dataset is shown as a dot. Each row corresponds to the impact of a different input parameter. The colour coding corresponds to whether it was a high or low value of the parameter. The x axis shows the final impact on the output of the model, which is how much the CST is changed for that given cluster and that given parameter value. For example: for cluster mass, low mass values (blue) correspond to a much lower SHAP/CST, whereas high mass values (red) correspond to a much higher SHAP/CST. On the other hand, most age values have minimal impact on CST, although high ages significantly reduce it. Bottom: SHAP value at a given pmdec as a function of pmdec and shown for all clusters in the validation dataset. Colour coding shows the Galactic longitude, l.
Current usage metrics show cumulative count of Article Views (full-text article views including HTML views, PDF and ePub downloads, according to the available data) and Abstracts Views on Vision4Press platform.
Data correspond to usage on the plateform after 2015. The current usage metrics is available 48-96 hours after online publication and is updated daily on week days.
Initial download of the metrics may take a while.