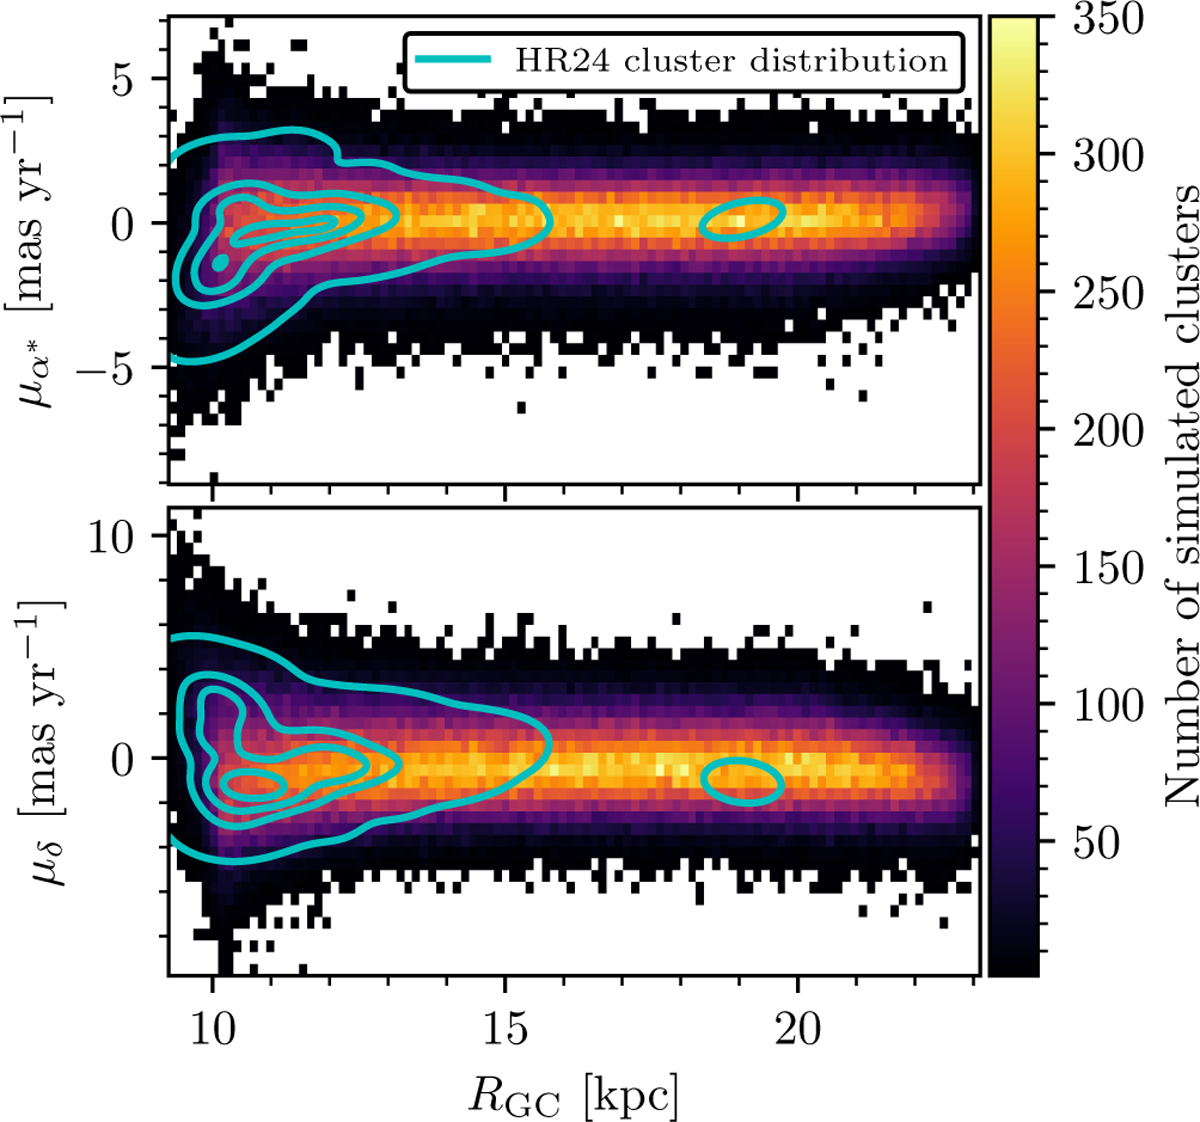
Fig. B.1
Download original image
Comparison between the proper motions of our injected clusters and clusters in HR24 as a function of galactocentric radius. All 192 318 simulated clusters are shown by the heatmap, with a colour bar on the right. The proper motion distribution of the 818 HR24 clusters within our studied region is shown by the kernel density estimate, with contours at the 0.1%, 20%, 50%, and 80% density levels.
Current usage metrics show cumulative count of Article Views (full-text article views including HTML views, PDF and ePub downloads, according to the available data) and Abstracts Views on Vision4Press platform.
Data correspond to usage on the plateform after 2015. The current usage metrics is available 48-96 hours after online publication and is updated daily on week days.
Initial download of the metrics may take a while.