Fig. A.1
Download original image
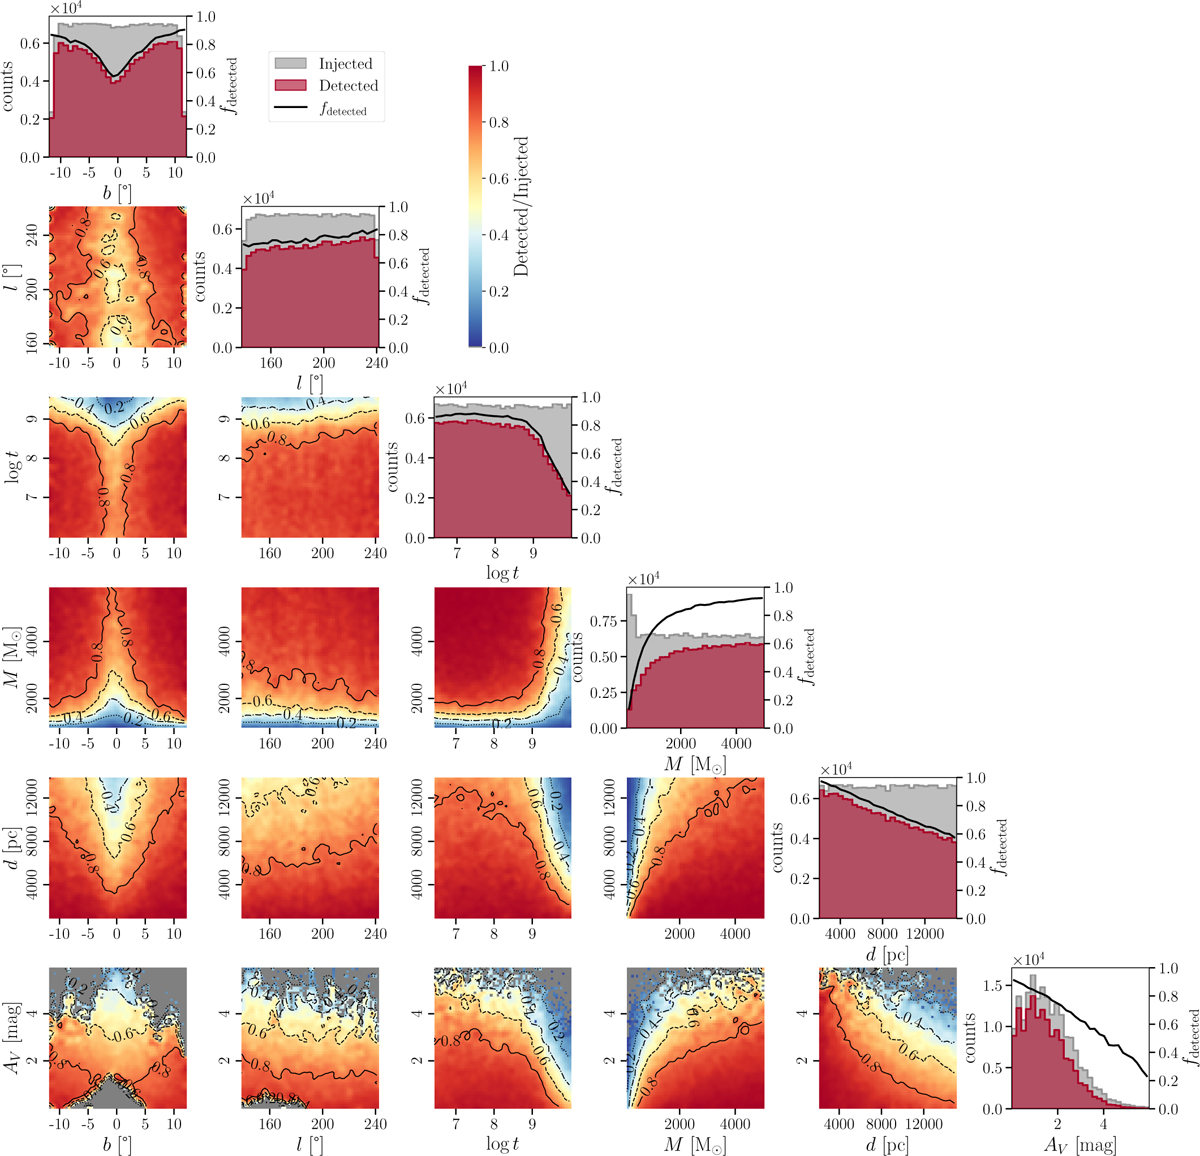
Cornerplot summarising the covariances between parameters further to those discussed in Sect. 4.1 and shown in Fig. 3. In the diagonal panels, we show the 1D parameter distributions of the simulated and recovered clusters in grey and red respectively. The fraction of detected objects are shown as a solid black line. The off-diagonal panels are heat maps showing the fraction of injected clusters that were recovered as a function of two parameters. We superimpose contours of iso-detectability with dotted, dash-dotted, dashed, and solid lines at fdetected equal to 0.2, 0.4, 0.6, and 0.8, respectively. Grey areas indicate regions of the parameter space where we do not inject OCs. These individual heatmaps can be used to visually find regions where, for instance, almost all clusters are detectable (solid red regions), where almost no clusters are detectable (solid blue regions), or regions where detectability changes sharply as a function of certain parameters, as well as the trend between them.
Current usage metrics show cumulative count of Article Views (full-text article views including HTML views, PDF and ePub downloads, according to the available data) and Abstracts Views on Vision4Press platform.
Data correspond to usage on the plateform after 2015. The current usage metrics is available 48-96 hours after online publication and is updated daily on week days.
Initial download of the metrics may take a while.