Fig. 10
Download original image
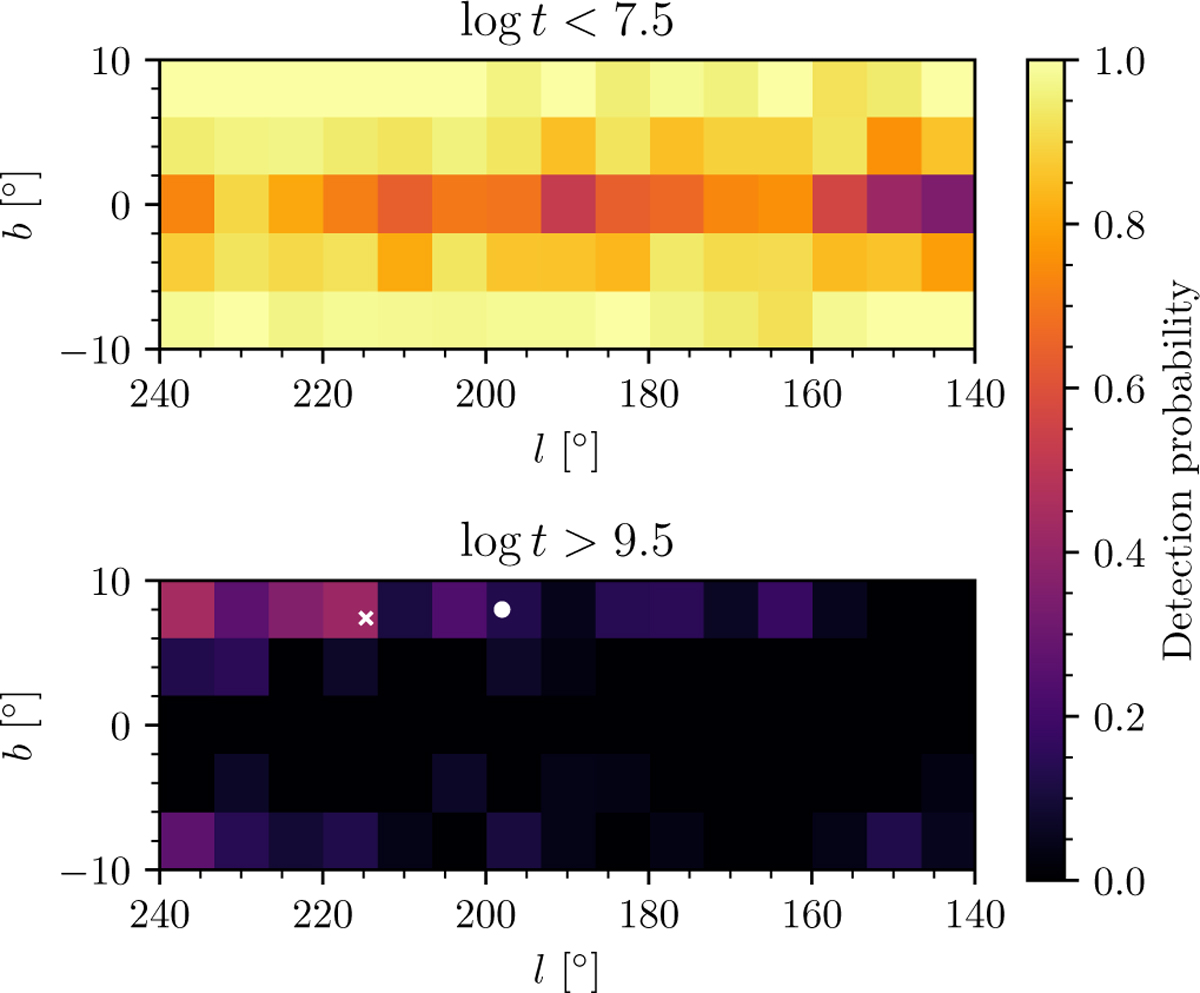
Fraction of simulated clusters recovered at young and old ages compared to the location of old distant clusters Berkeley 29 and Saurer 1. Top: sky distribution of simulated cluster recoveries for young clusters log t < 7.5, at distances greater than 10 kpc, and with masses in the range 1500 < M < 2500 M⊙. Bottom: as above, but for old clusters with log t > 9.5. The location of Berkeley 29 is indicated by a white circle; the location of Saurer 1 is indicated by a white cross.
Current usage metrics show cumulative count of Article Views (full-text article views including HTML views, PDF and ePub downloads, according to the available data) and Abstracts Views on Vision4Press platform.
Data correspond to usage on the plateform after 2015. The current usage metrics is available 48-96 hours after online publication and is updated daily on week days.
Initial download of the metrics may take a while.