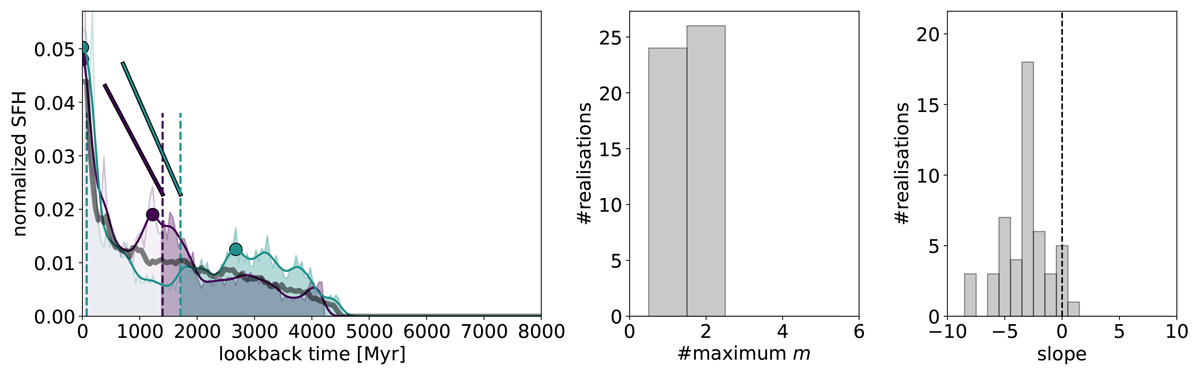
Fig. 9.
Download original image
Illustration of our method for measuring the formation age ageform, slope, number of maxima, and age of the first peak for an individual SFH drawn from the posterior distribution of each galaxy. The left panel shows two realisations of the SFH for the same galaxy from the COSMOS2020 catalogue (purple and cyan lines, smoothed with a Gaussian kernel with a standard deviation 100 Myr), together with the median over 50 realisations (grey line). The dashed vertical line indicates ageform, which was then used to compute the slope (solid straight segments). The circles indicate the position of the persistent maxima. The middle and right panels show the histograms of the numbers of maxima and slopes over 50 realisations.
Current usage metrics show cumulative count of Article Views (full-text article views including HTML views, PDF and ePub downloads, according to the available data) and Abstracts Views on Vision4Press platform.
Data correspond to usage on the plateform after 2015. The current usage metrics is available 48-96 hours after online publication and is updated daily on week days.
Initial download of the metrics may take a while.